The Australian Taxation Office (ATO) releases annual data on SMSFs, with the latest for 2015/2016 issued a few weeks ago. It is not up-to-date because of the time it takes trustees to lodge returns, and it includes estimates for some numbers. Notwithstanding the data shortcomings, the ATO issued an interesting graphic this year, including sections on assets, contributions and benefits, and member characteristics.
It was good to see, for example, that we finally have more corporate trustees than individual trustees, given the benefits of the former. It's also notable that benefits paid were larger than contributions as more SMSFs are moving into pension phase. However, SMSFs are not only popular with retirees, with the median age of members establishing a new SMSF in 2016 at 47 years, versus the median age for all members at 59 years.
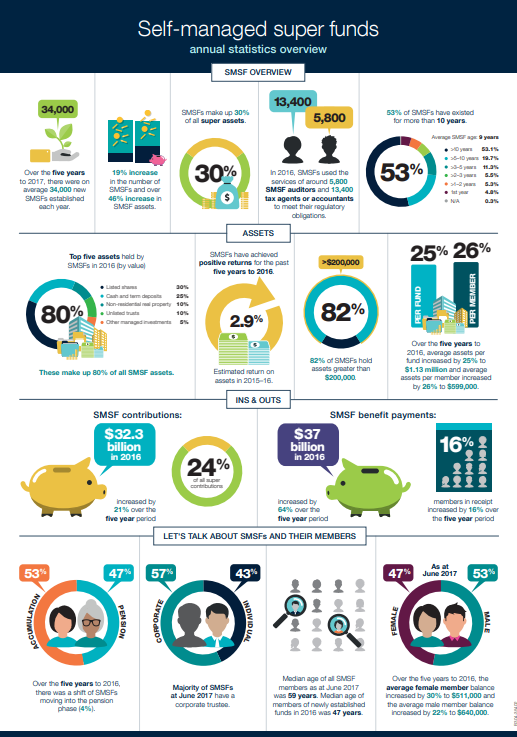
Click to enlarge
Given the delays and estimates in the ATO data, SMSF administrators produce more up-to-date reports from their funds. SuperConcepts, for example, undertakes a quarterly analysis of its SMSF client investments. The results show a shifting of investor behaviour in response to regulations, market moves and expectations.
Portfolio shifts to equities
The changes applying to superannuation from 1 July 2017 were the most significant since 2007. From 1 July 2017, members can only benefit from tax-free pension accounts for a total value of up to $1.6 million. New reduced contribution caps also began to apply to member balances.
The SuperConcepts SMSF Investment Patterns Survey covers about 2,670 funds. The assets of the funds surveyed represented approximately $3.2 billion as at 31 December 2017.
In anticipation of the superannuation changes, cash levels for the June 2017 quarter showed a significant increase, from 18.0% at the end of March to 19.8% at the end of June. This cash was invested during the September and December quarters, mainly into Australian and international equities markets.
Year on year, end December 2017 versus end December 2016, investment in Australian shares (36.0% to 36.9%) and international shares (13.1% to 14.2%) increased at the expense of cash levels (18.4% to 17.3%) and investment in property (19.6% to 19.0%).
Exposure to international equities increased from 13.9% to 14.2% even from the September quarter to the December quarter. SuperConcepts suggests that:
“When looking at performance in the different sectors and currency movements, the theoretical allocation should have declined to 13.5% if trustees had left their allocation unchanged for the quarter.”
The inescapable inference is an active decision by trustees to direct new funds into the international equity market. The allocation to managed funds in the international equity sector also increased, although this is likely to be higher than for SMSFs generally as SuperConcepts is part of AMP and investment patterns are influenced by the decisions of financial advisers. The report concludes that
“… pooled structures are the preferred method of investing in overseas markets due to the complications still present in investing overseas directly.”
Largest holdings
The 10 largest investments represented 14.2% of the total SMSF assets held, out of 7,850 investments in the SMSFs covered in the survey. Two of the top 10 are pooled structures used for accessing international equities which have solidified their positions at number 4 and 6 on the list.
The most commonly held investments (by investment size) as at 31 December 2017 were:
- Commonwealth Bank
- Westpac Banking Corporation
- National Australia Bank
- Magellan Global Fund
- BHP Billiton Limited
- Platinum International Fund
- ANZ Limited
- Telstra Corporation
- CSL
- Wesfarmers
There’s little change in this compared with the top 10 holdings as at 31 December 2016. Magellan and Platinum have moved up from the 6th and 8th position respectively to 4th and 6th, possibly reflecting a preference for international equities.
The SMSF Investment Patterns Survey as at 31 December 2015 had similar rankings except Telstra was in 3rd position and it is now in 8th position. In part the rankings in general may reflect share price rather than a change in holdings. Another clue to Telstra’s fall may be contained in the investment patterns of pension funds versus accumulation funds, as we explore below. Pension SMSFs (funds with at least one member in pension phase) make up half of the 600,000+ SMSFs. These funds are generally expected to be more conservative and are stereotyped as chasing yield.
Pension vs accumulation SMSFs
Class Limited also issues an SMSF Benchmark Report, and in the December 2017 quarter, it answers the question of whether pension SMSFs match their stereotypes.
The Benchmark Report states that:
“The average age of a pension SMSF member is 70 years, compared to 52 for accumulation SMSF members. And with nearly twenty more years to accumulate wealth, SMSFs with at least one member in pension phase have an average balance that is over 151% higher than accumulation SMSFs – $1,939,985 compared to $772,947. In fact, pension SMSFs make up half of all funds, but they hold 71% of total net assets.”
In March 2016, when Class published its first Benchmark Report, over 55% of SMSFs held Telstra. By December 2017, Telstra was still the most widely-held ASX stock, but it had reduced to being held by 50% of SMSFs. Class wonders whether some of that shift was due to Telstra’s August 2017 announcement to reduce dividend payouts.
What the Benchmark Report also reveals is that pension SMSFs:
- Are three times as likely to invest in defensive debt securities compared with accumulation SMSFs, and
- Despite holding slightly more cash than accumulation SMSFs, they allocate a 43% greater proportion to domestic equities compared to accumulation SMSFs.
Accumulation SMSFs, on the other hand:
- Allocate nearly three times as much to residential property, and
- And are 12 times more likely than pension SMSFs to borrow money to invest in residential property.
When pension SMSFs do invest in property, the preference is commercial property. Class suggests that “Perhaps this is another example of the pension fund’s need for income as commercial properties deliver a more reliable and higher rental yield.”
Regulations affect contributions
Since 1 July 2017, members with a balance in excess of $1.6 million as at 30 June of the prior financial year are no longer able to make non-concessional contributions to super. The average non-concessional contribution in the December 2017 quarter was $1,852 compared to $2,050 for the September 2017 quarter and $26,900 for the June 2017 quarter.
The average benefit payment was $12,218, down from $25,342 for the September quarter and a sizeable outlier of $50,313 for the June quarter.
The June quarter increase resulted from members adjusting their pension balances to the new $1.6 million Transfer Balance Cap. Members are able to hold their remaining balance in accumulation phase where earnings are taxed at 15% compared to 0% for pension balances.
Lump sum withdrawals were not affected. The split between lump sum withdrawals versus pension payments for the quarter was 12% versus 88%, which is similar compared to prior quarters.
Looking ahead to the next quarter, SuperConcepts says:
“It will be interesting to see whether we see a spike in lump sum benefit payments as trustees implement lump sum withdrawal strategies to help stay under the $1.6 million pension transfer balance cap.”
Tax and regulatory versus economic drivers
For now, domestic tax and regulatory drivers seem to explain the changes in investment patterns, as well as a growing preference for international equities.
However, the global economy is in the midst of an unprecedented era. The phenomenally low-interest rate cycle may finally turn, with serious implications even if doesn’t turn. The aggregate size of the balance sheets of the G4 central banks (the Fed, BOJ, BOE, and ECB) is around US$16 trillion, and the holdings are more diversified than only Treasury bonds, with only the US Fed indicating a path to asset reduction. The financial markets have never sat across an overhang of this size. Even with the Fed, the jury is still out on whether asset sale plans can be effected without a severe disruption.
Such global winds will affect Australia.
Vinay Kolhatkar is an Assistant Editor at Cuffelinks. This article is in the nature of general information and does not consider the circumstances of any investor.