Register For Our Mailing List

Register to receive our free weekly newsletter including editorials.

Home / 623

A perfect storm for housing affordability in Australia

I don’t think anybody in Australia would disagree that the cost of housing is expensive. It’s always been hard to enter the market for the first time, but housing costs have rarely been as significant relative to incomes as they are currently.

Over recent decades there have been many factors which have conspired to make housing expensive. I am going to unpack what these factors are and how they have led to the eye-watering housing costs we have today.

Lending preferences

After Australia fell into a deep recession in the early 1990s, lender’s lending preferences have shifted away from business lending and towards residential property lending. Keep in mind, many small businesses are financed by the equity in residential properties, so the increase in housing costs has enabled people to create new businesses but they have increasingly relied on housing equity to fund those businesses rather than business credit.

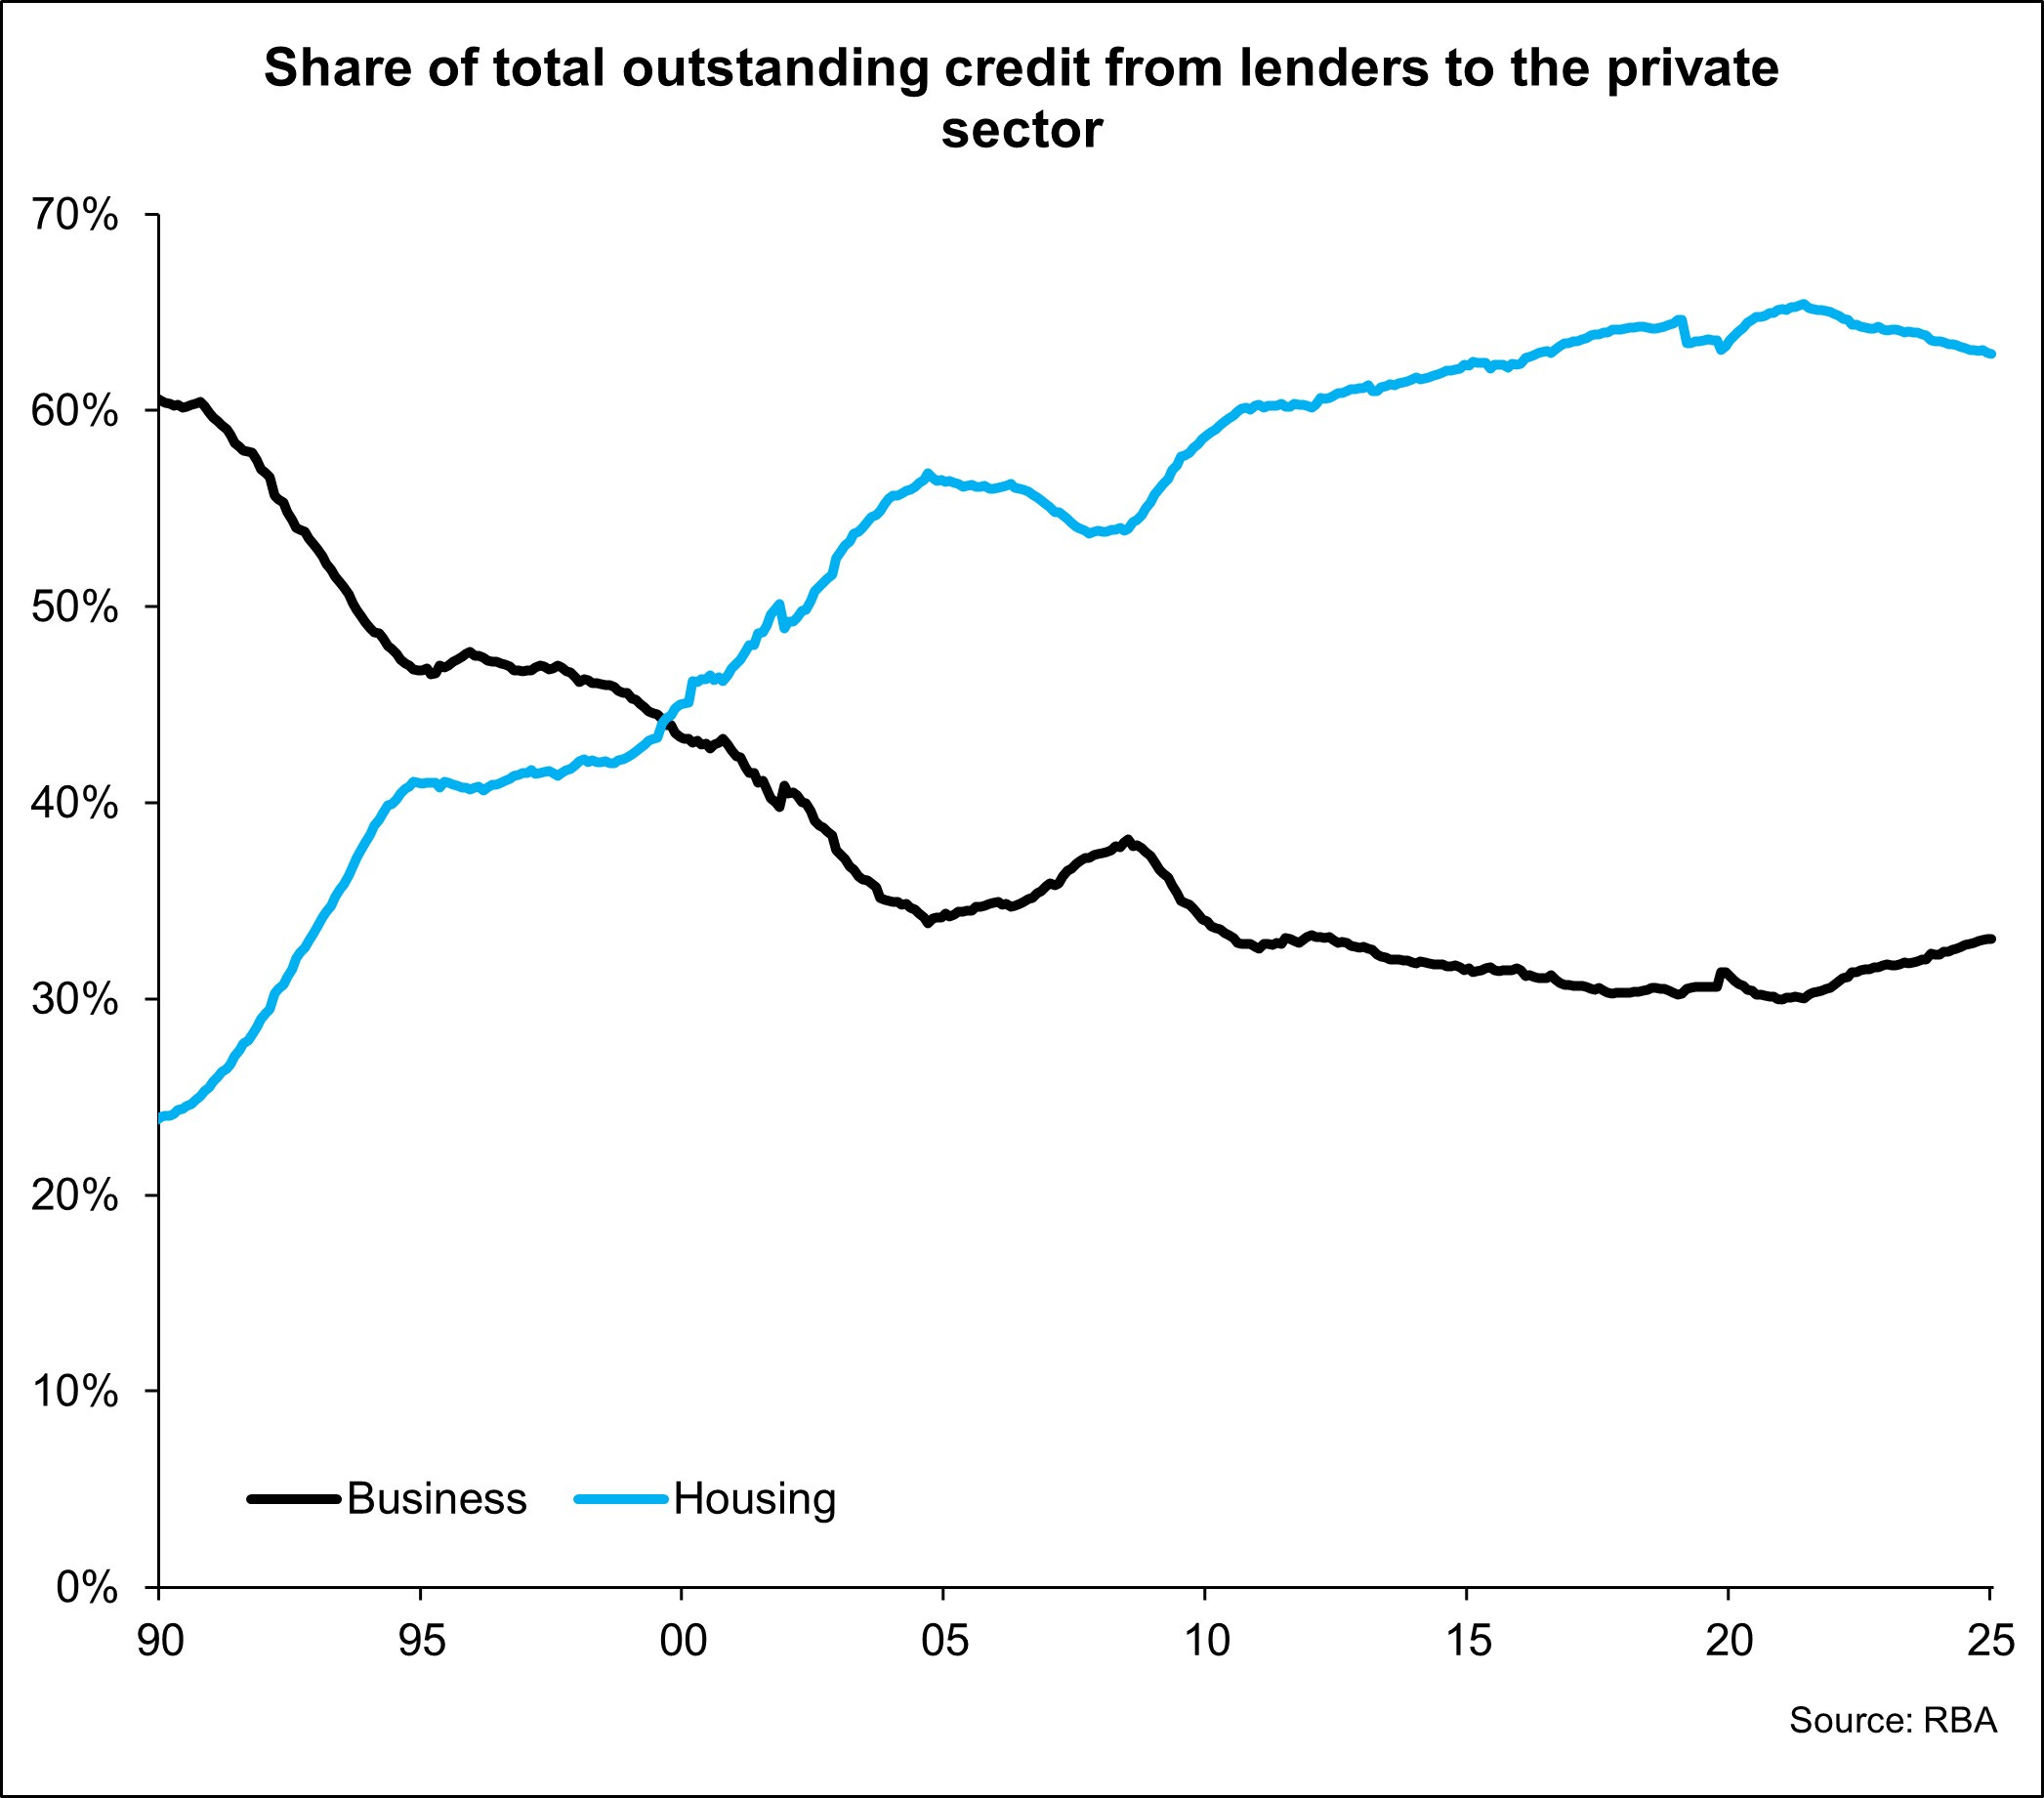
At the start of the 1990s, just as the recession hit, around 60% of all outstanding credit to the private sector was lending for business. Fast forward to today and around 62% of all outstanding credit to the private sector is to housing.

With the history of lower defaults resulting in relatively lower risk for lenders, it is no surprise that lenders over recent decades have shown a strong preference to lend to housing rather than business. The byproduct of this freeing up of finance for housing has been increased demand for housing. It has increased how much households can borrow for their mortgage and contributed to higher housing costs.

The long ongoing fall in interest rates over the past 35 years

Lower interest rates result in an increase in borrowing capacities and over recent decades these lower interest rates have ended up being capitalised into higher property prices.

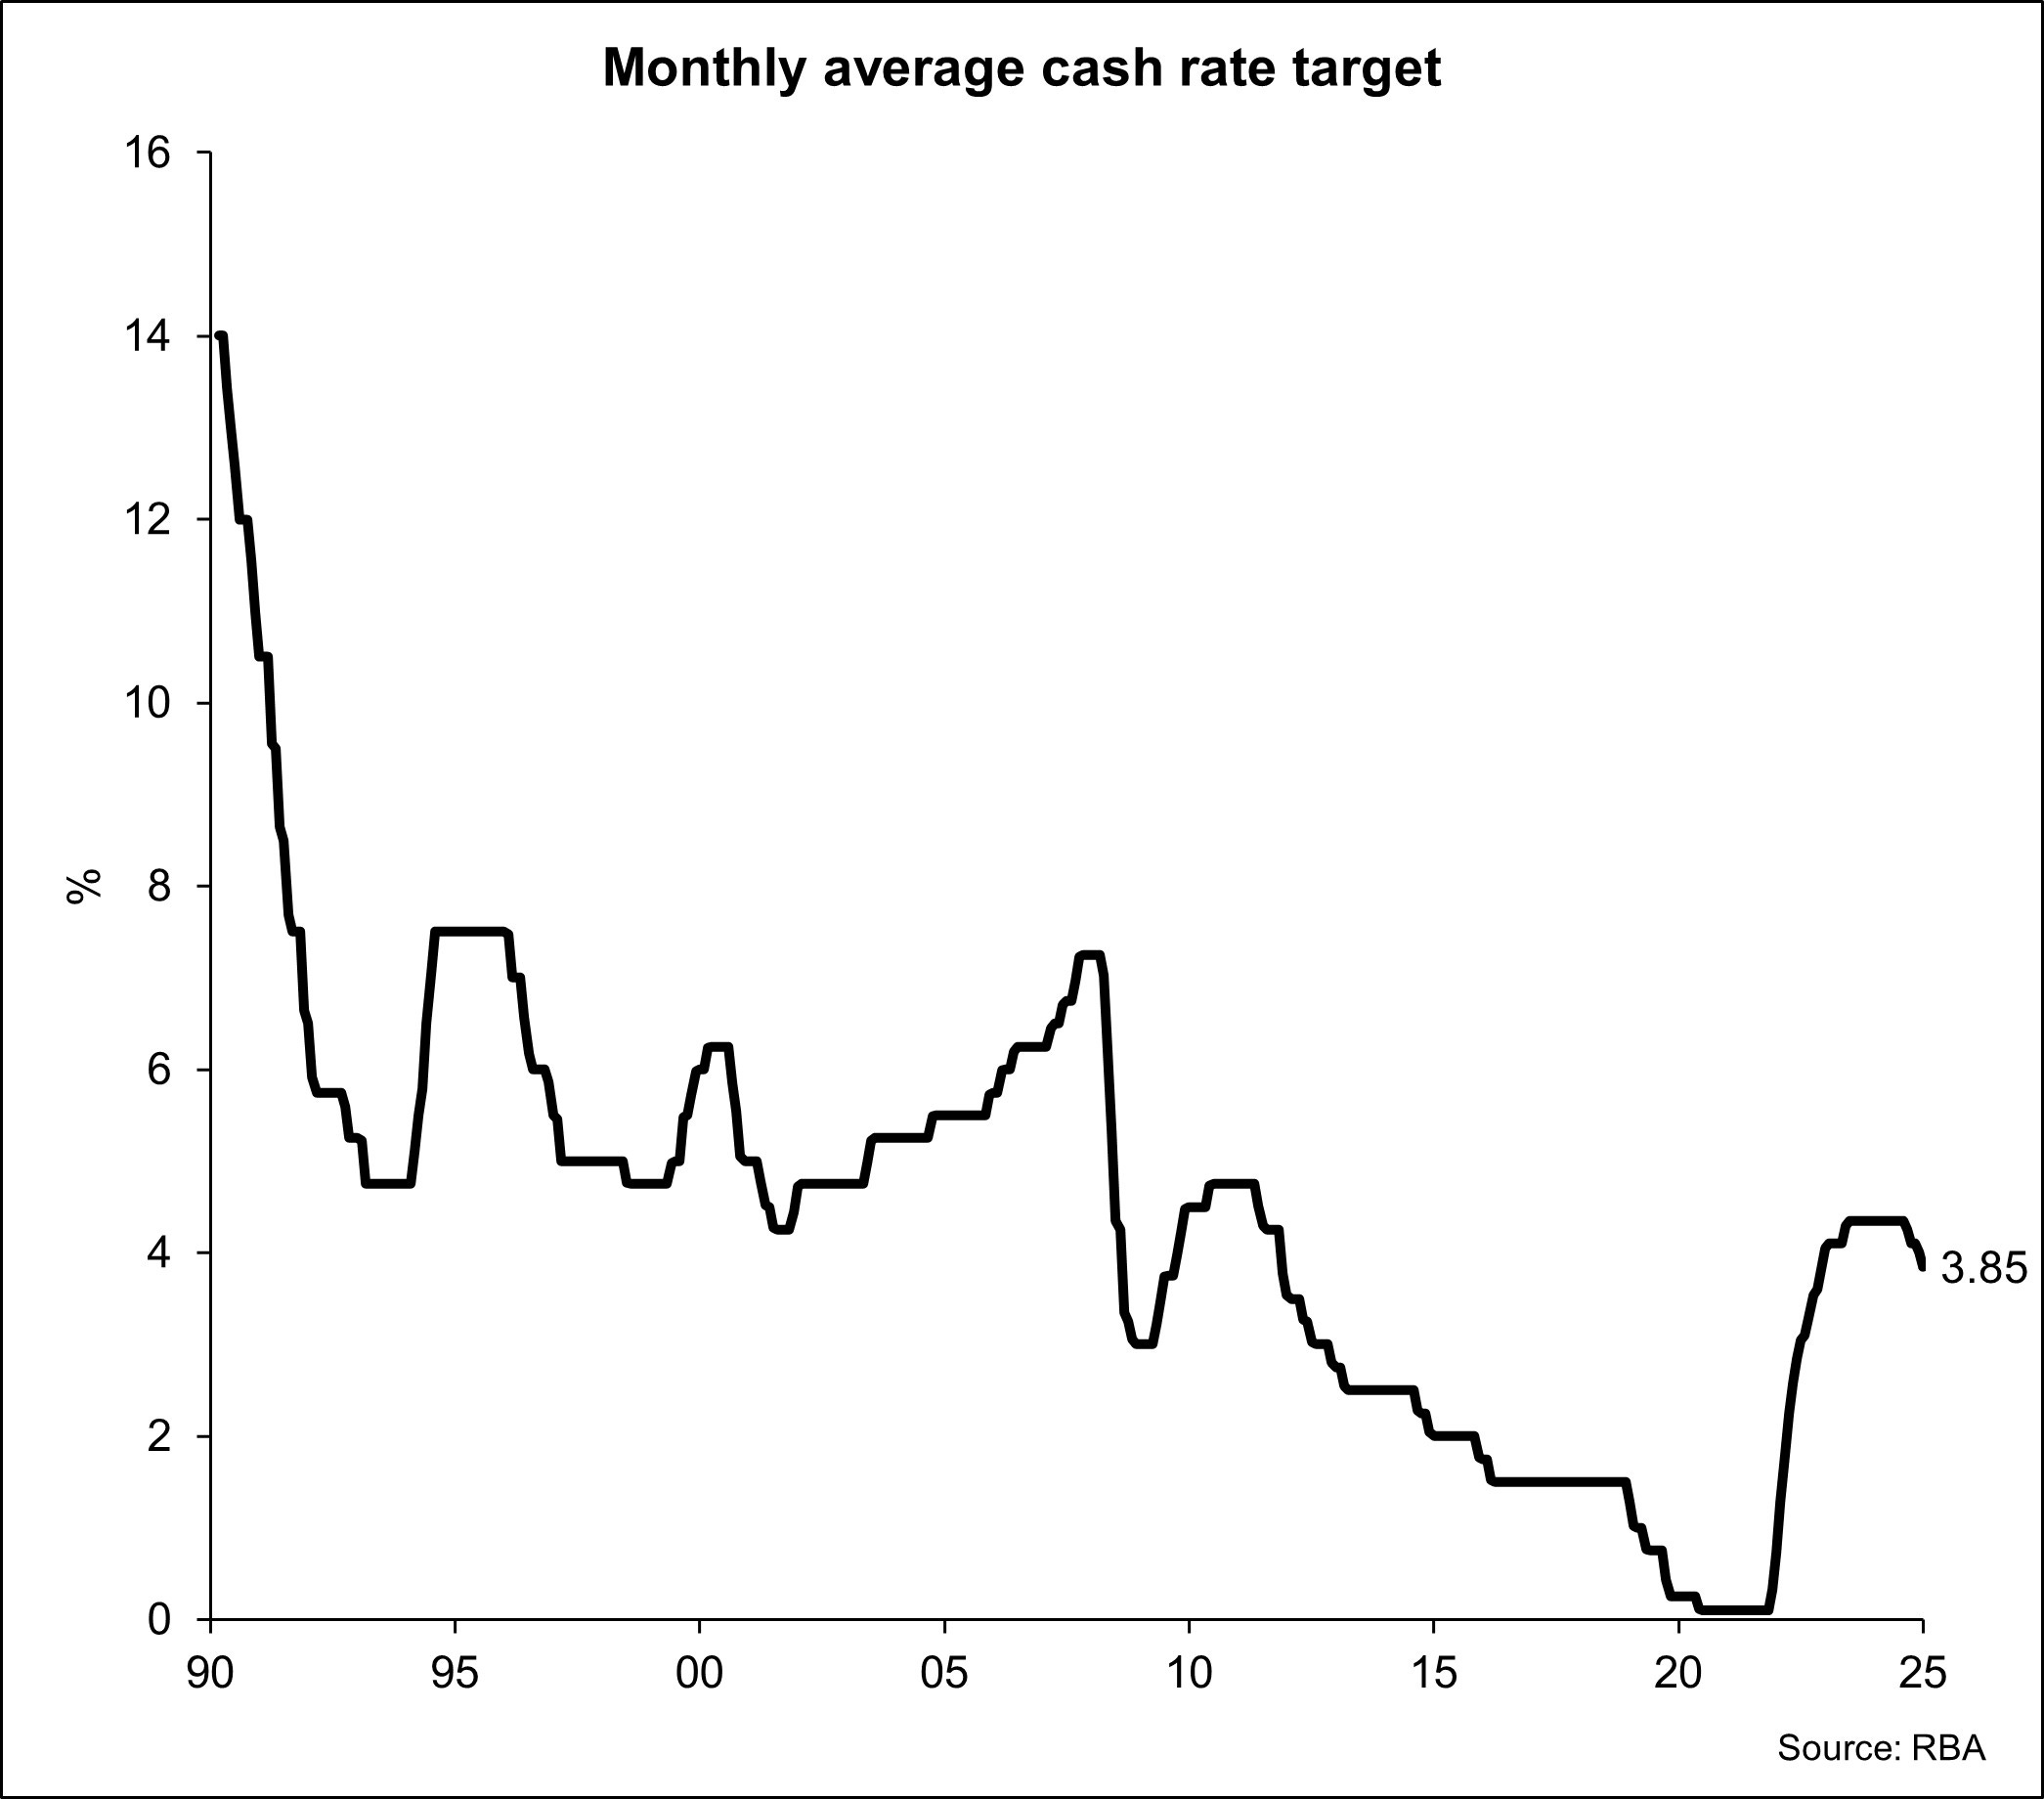
While there have been some periods since 1990 where interest rates have increased, the long-term trend over the period has been a decline in interest rates. As interest rates have trended lower, borrowing capacities have increased, banks have been willing to make more credit available to home purchasers, and this has pushed prices higher.

Financialisation of shelter

I don’t necessarily think the financialisation of shelter is something that has just occurred in recent decades, but I sense it has been exacerbated recently.

Most people no longer just see where they live as offering them shelter, they view it as a financial asset and a way in which they can increase their wealth as the value of the property increases.

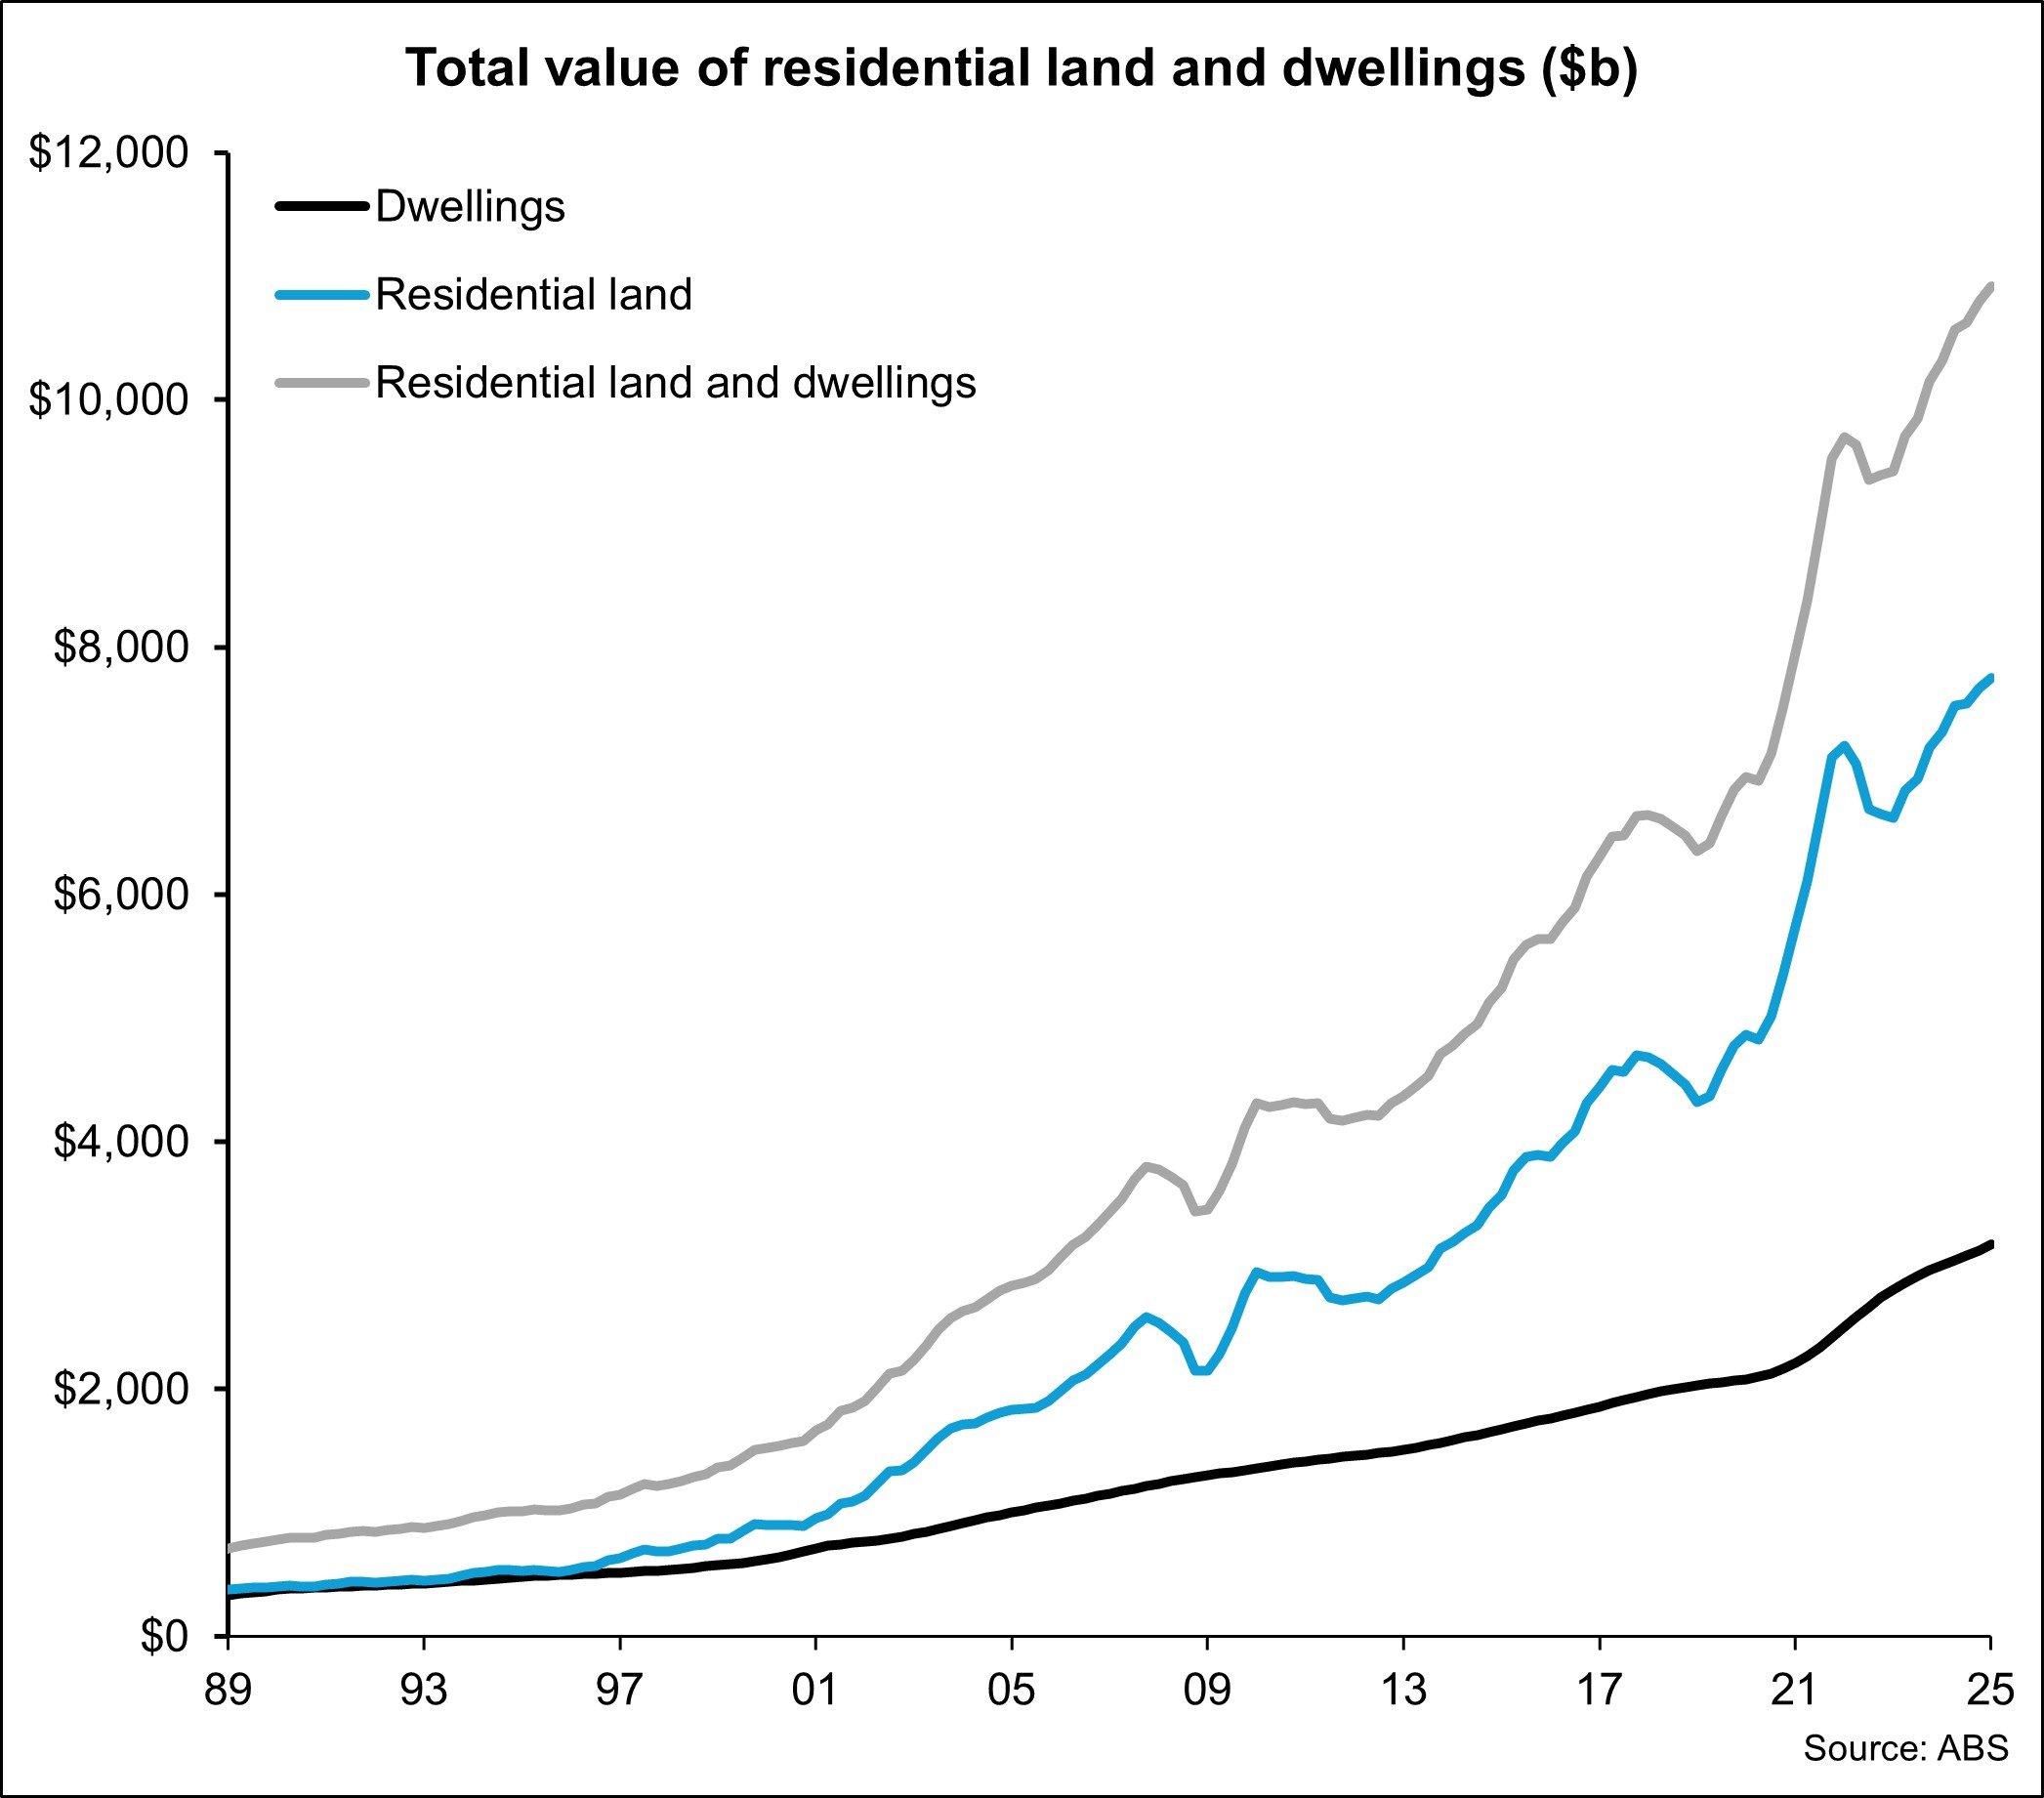
If we go back to March 1990, the total value of residential land and dwellings was $780.5 billion, accounting for 48.7% of total household assets. Fast forward to March 2025, the total value of residential land and dwellings owned by households has risen to $10.919 billion or 53.1% of total household assets.

Between March 90 and March 25, the total value of residential land and dwellings has increased by 1299% or at a compound annual rate of 7.8% over the 35-year period.

While increasing property values have led to higher household net worth, higher housing prices have also meant that when owners sell properties and buy a new property, they have to increasingly borrow more to do so. Having equity in the housing market has become an unfair advantage that existing owners have and brand new purchasers don’t.

Rise in household incomes and dual income households

Since the beginning of the 1990s, at times we’ve seen at times strong increases in real household incomes. As incomes have risen, we’ve also seen an increasing prevalence of dual income households at a time in which property prices have fairly consistently been rising.

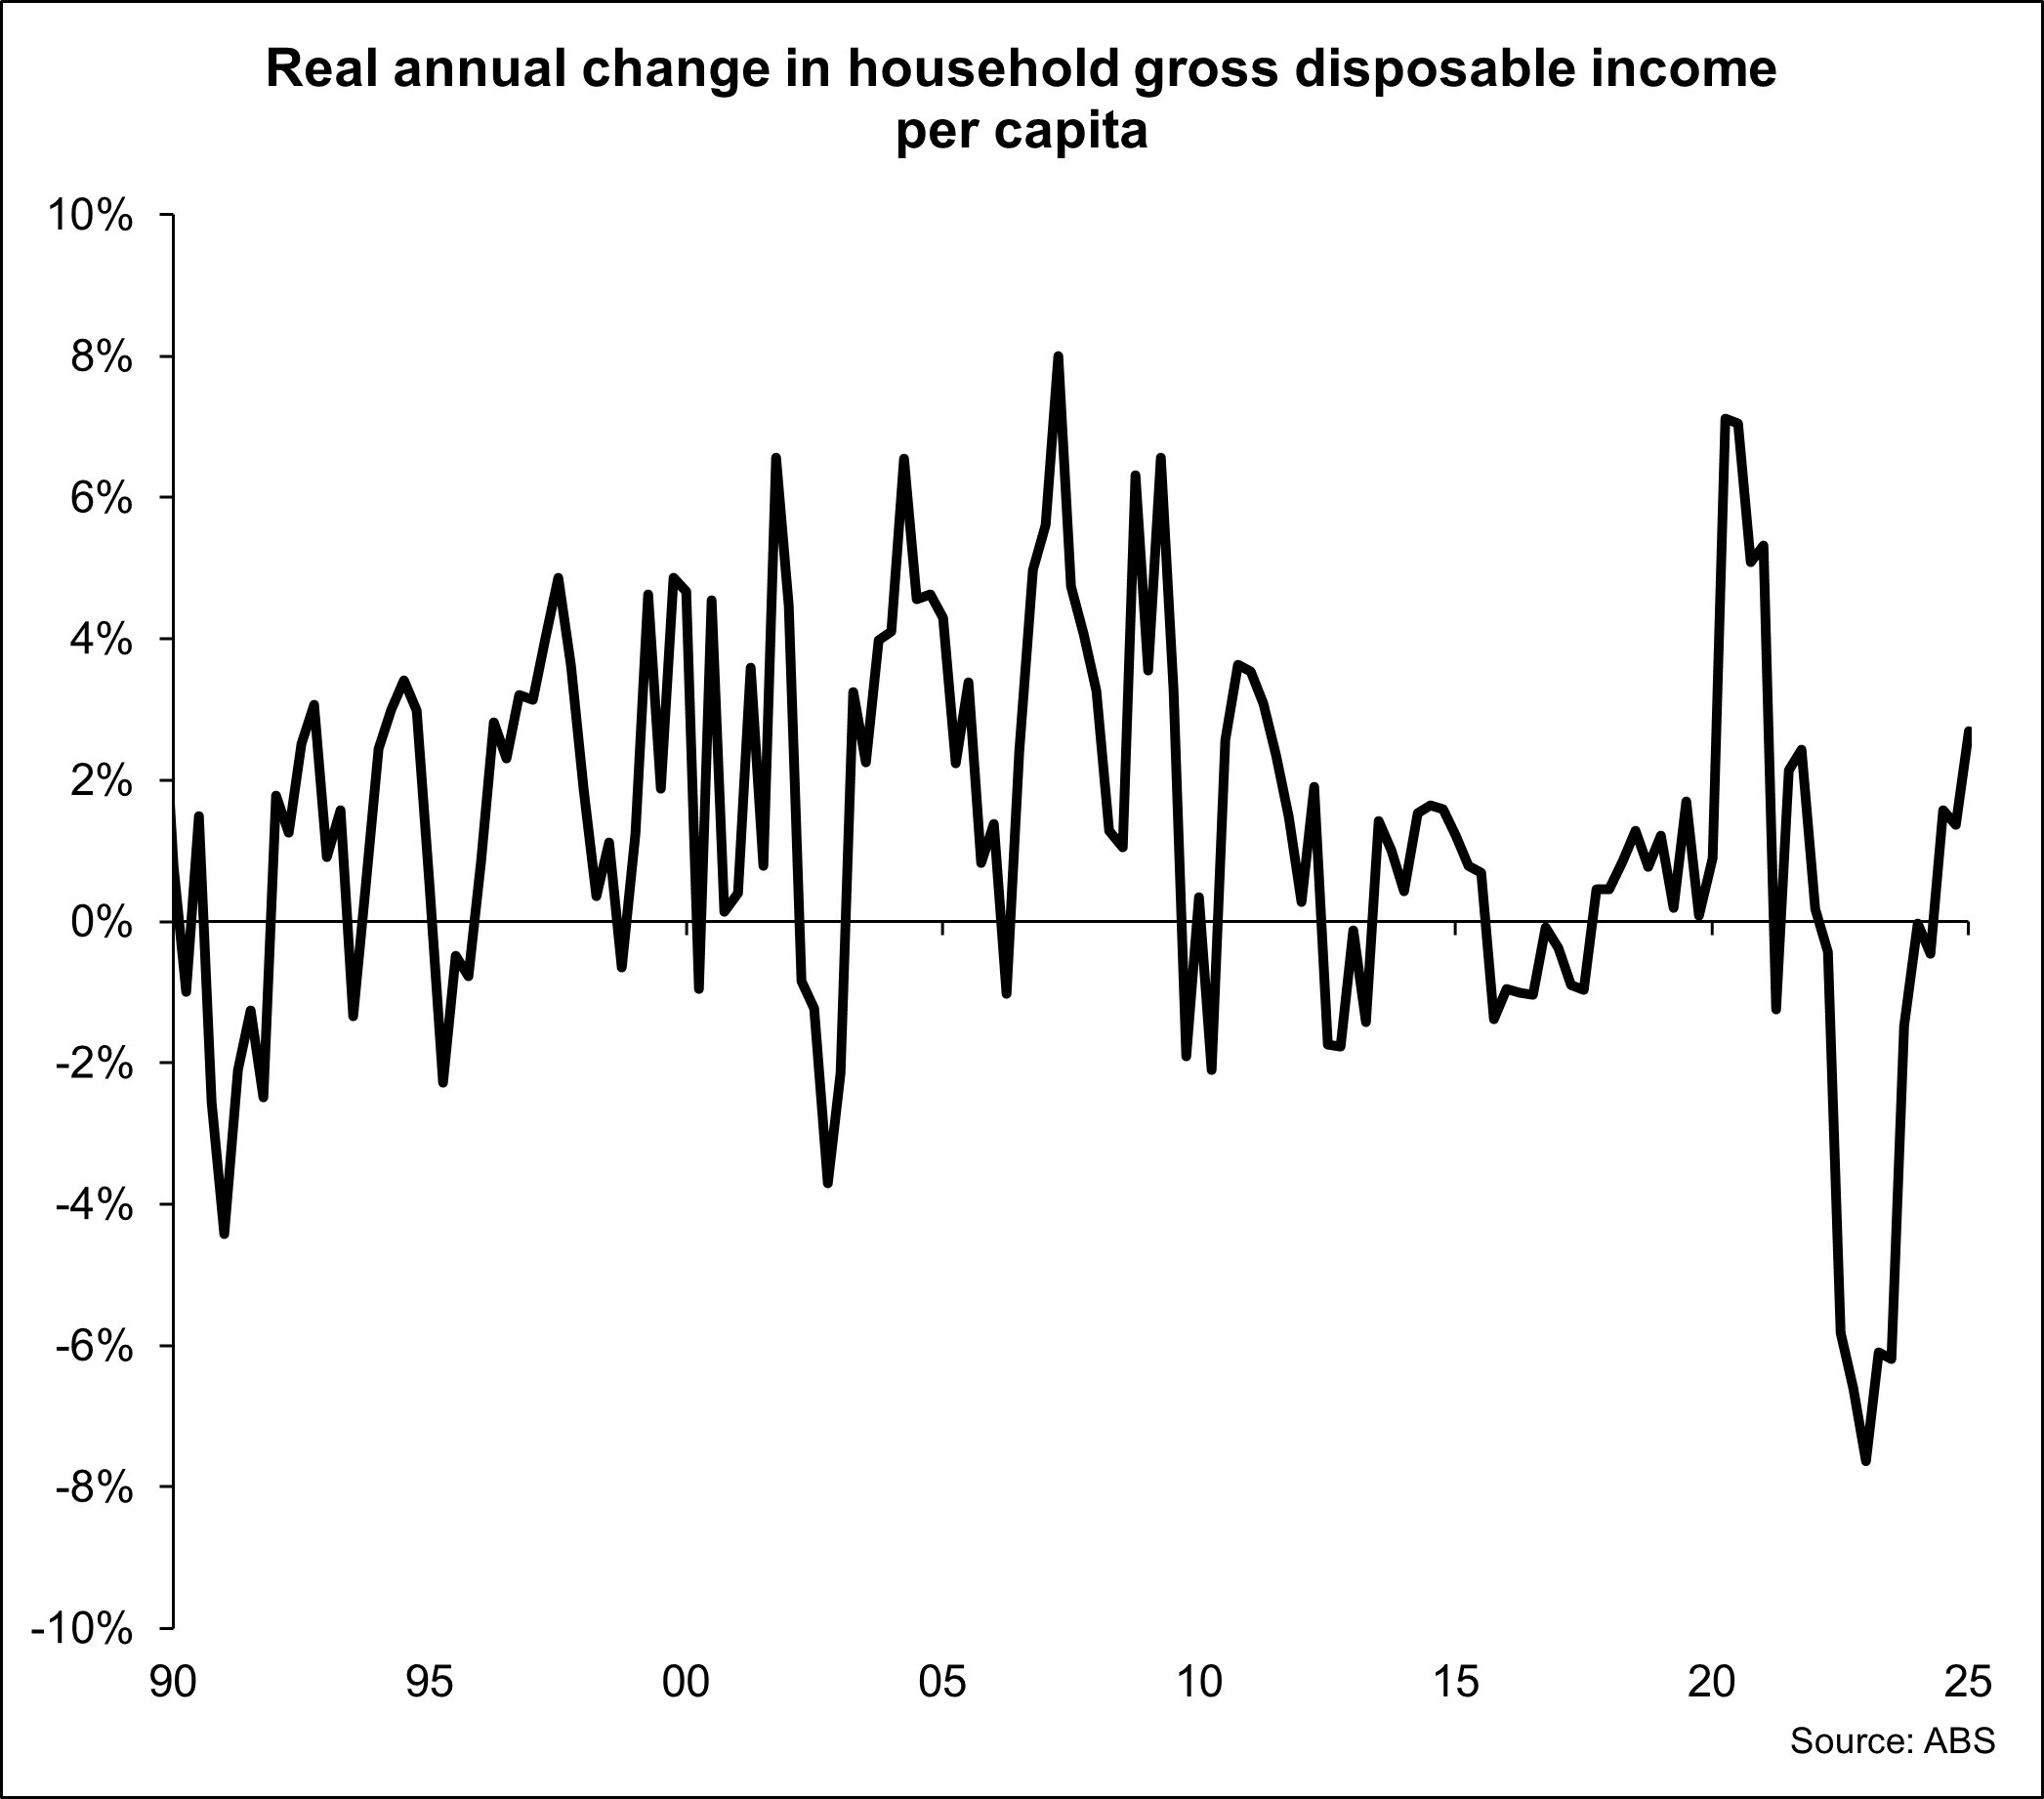
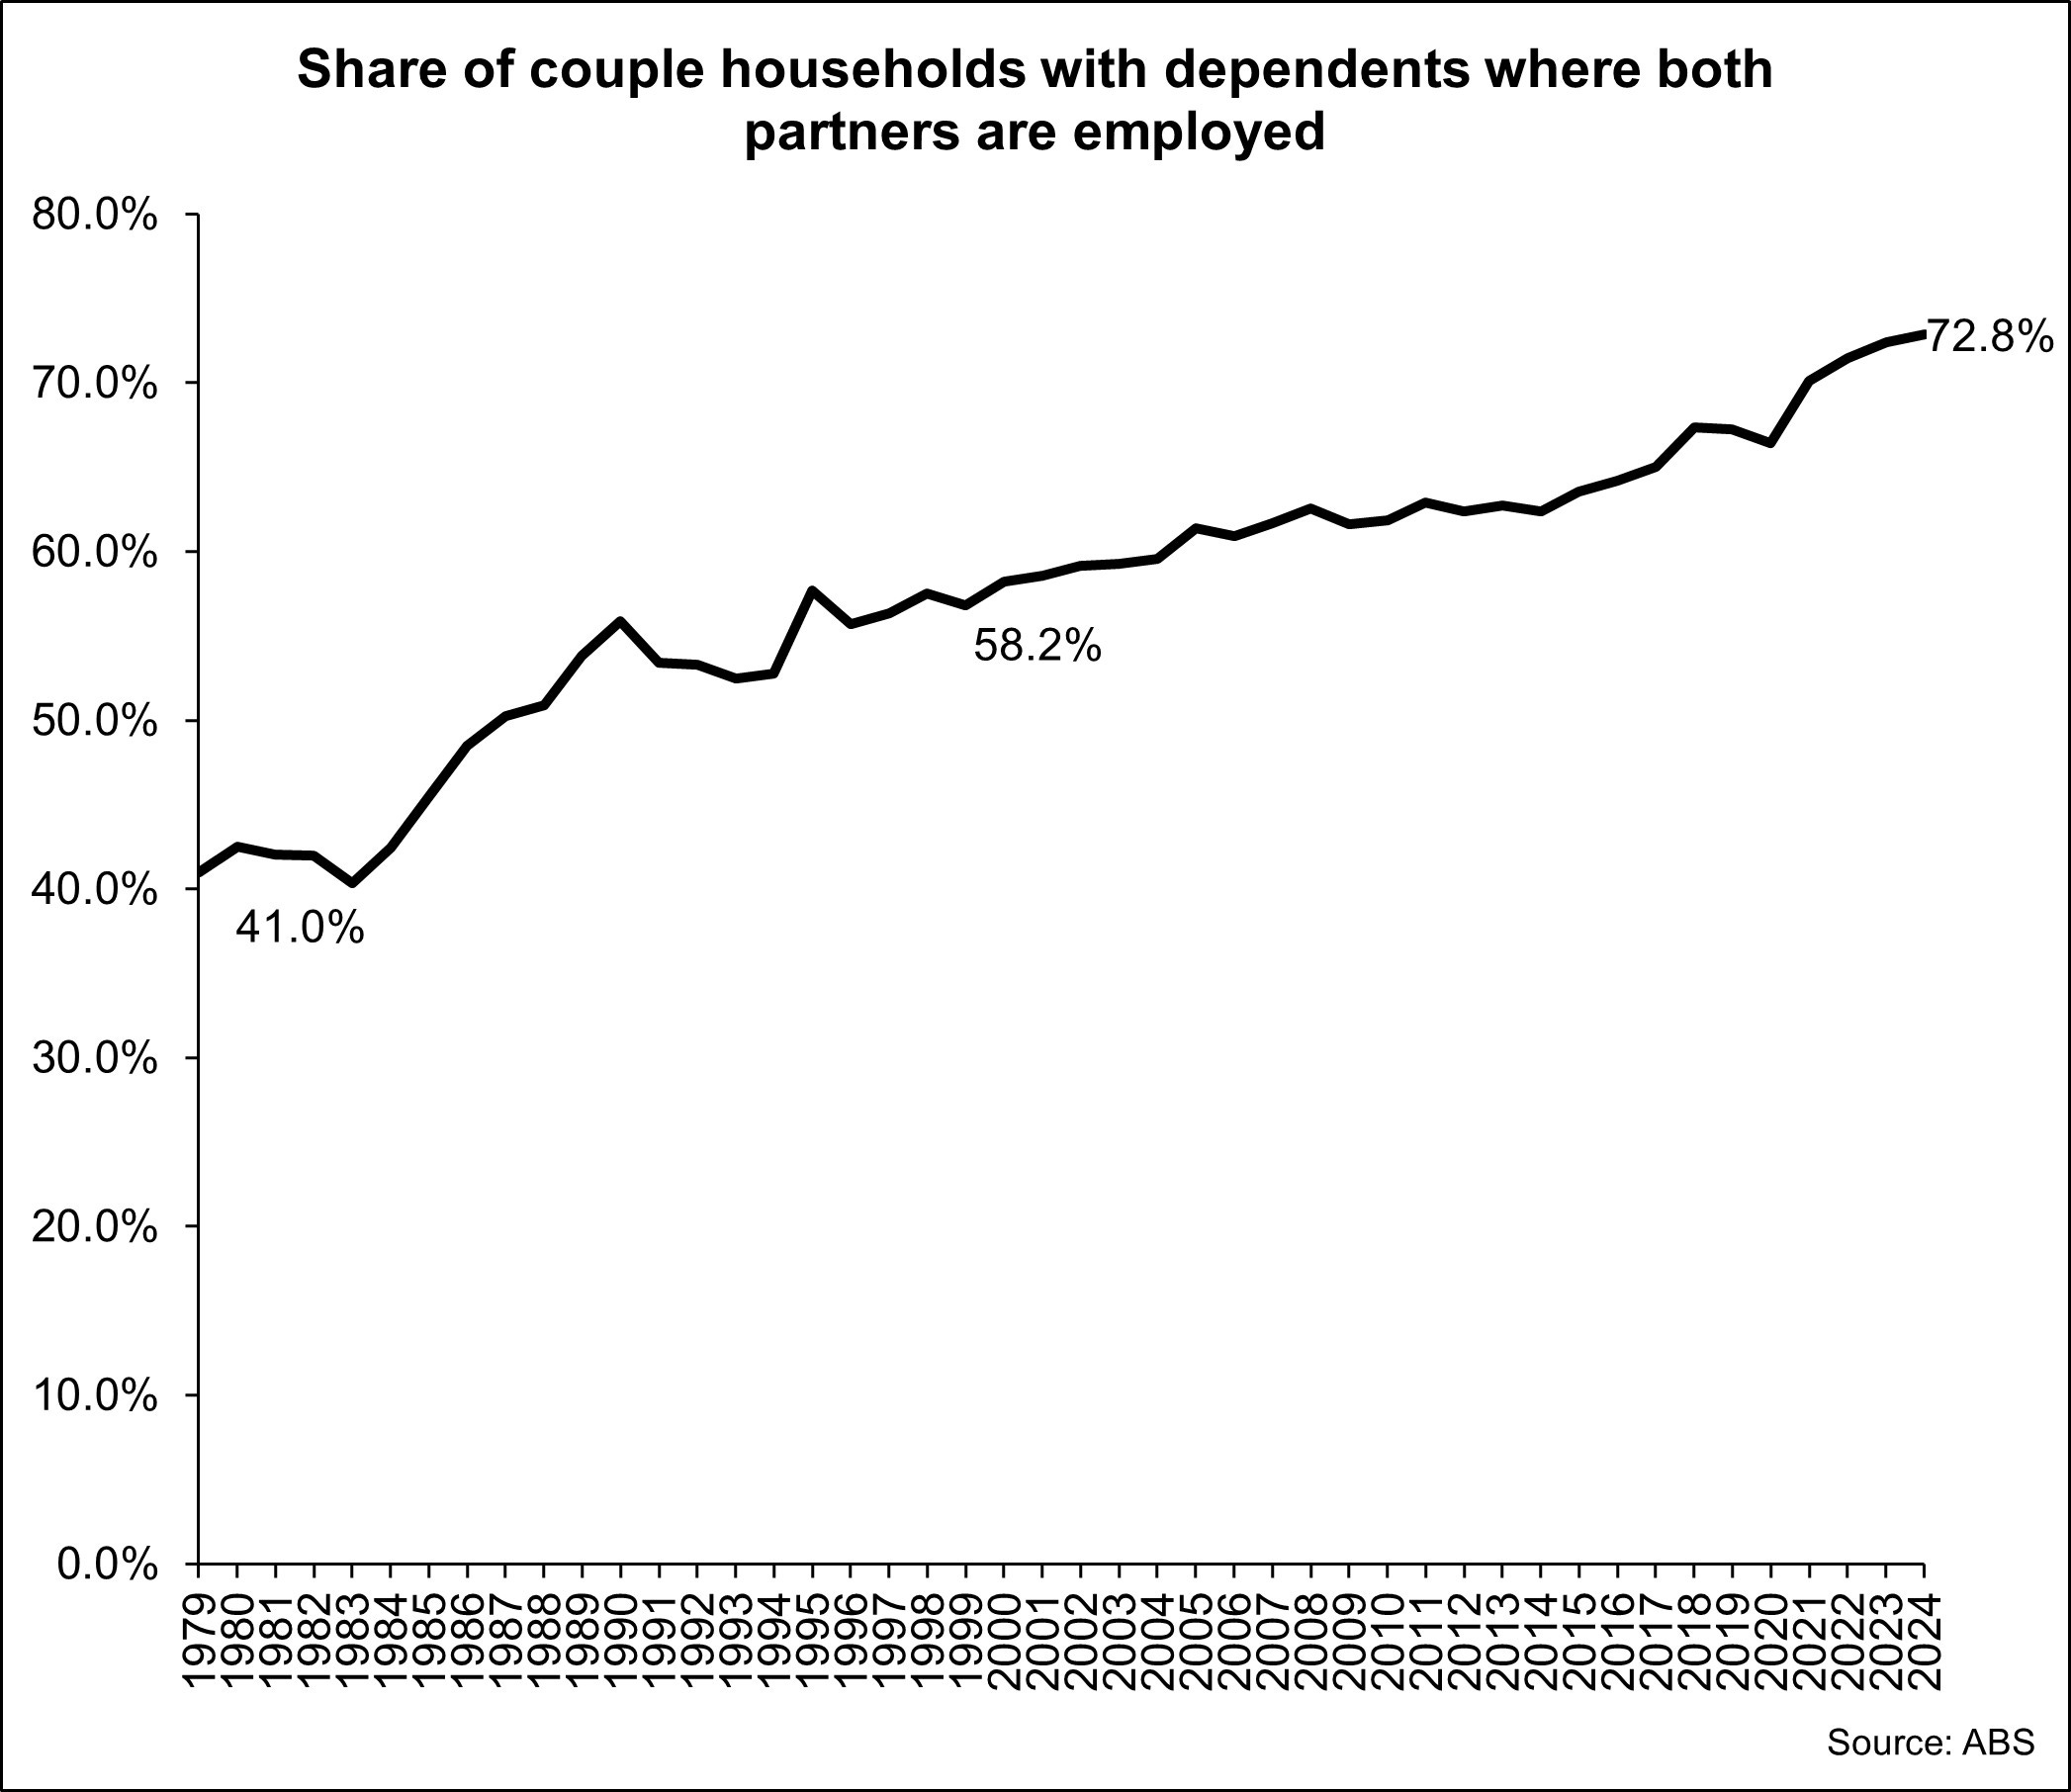
The escalation in household incomes, which appears to have been driven by an increase in workforce participation and more dual income households, has largely resulted in higher housing costs.

As a result, parents are working more, and their children are spending more time in childcare and outside of school hours care. We seem to have sacrificed time not working for higher housing costs, and it doesn’t seem to be a sacrifice that most households have grappled with too much. It’s just been accepted.

A highly urbanised population

Australia has a highly urbanised population with the World Bank reporting that in 2024, 86.75% of the total population lived in an urban area.

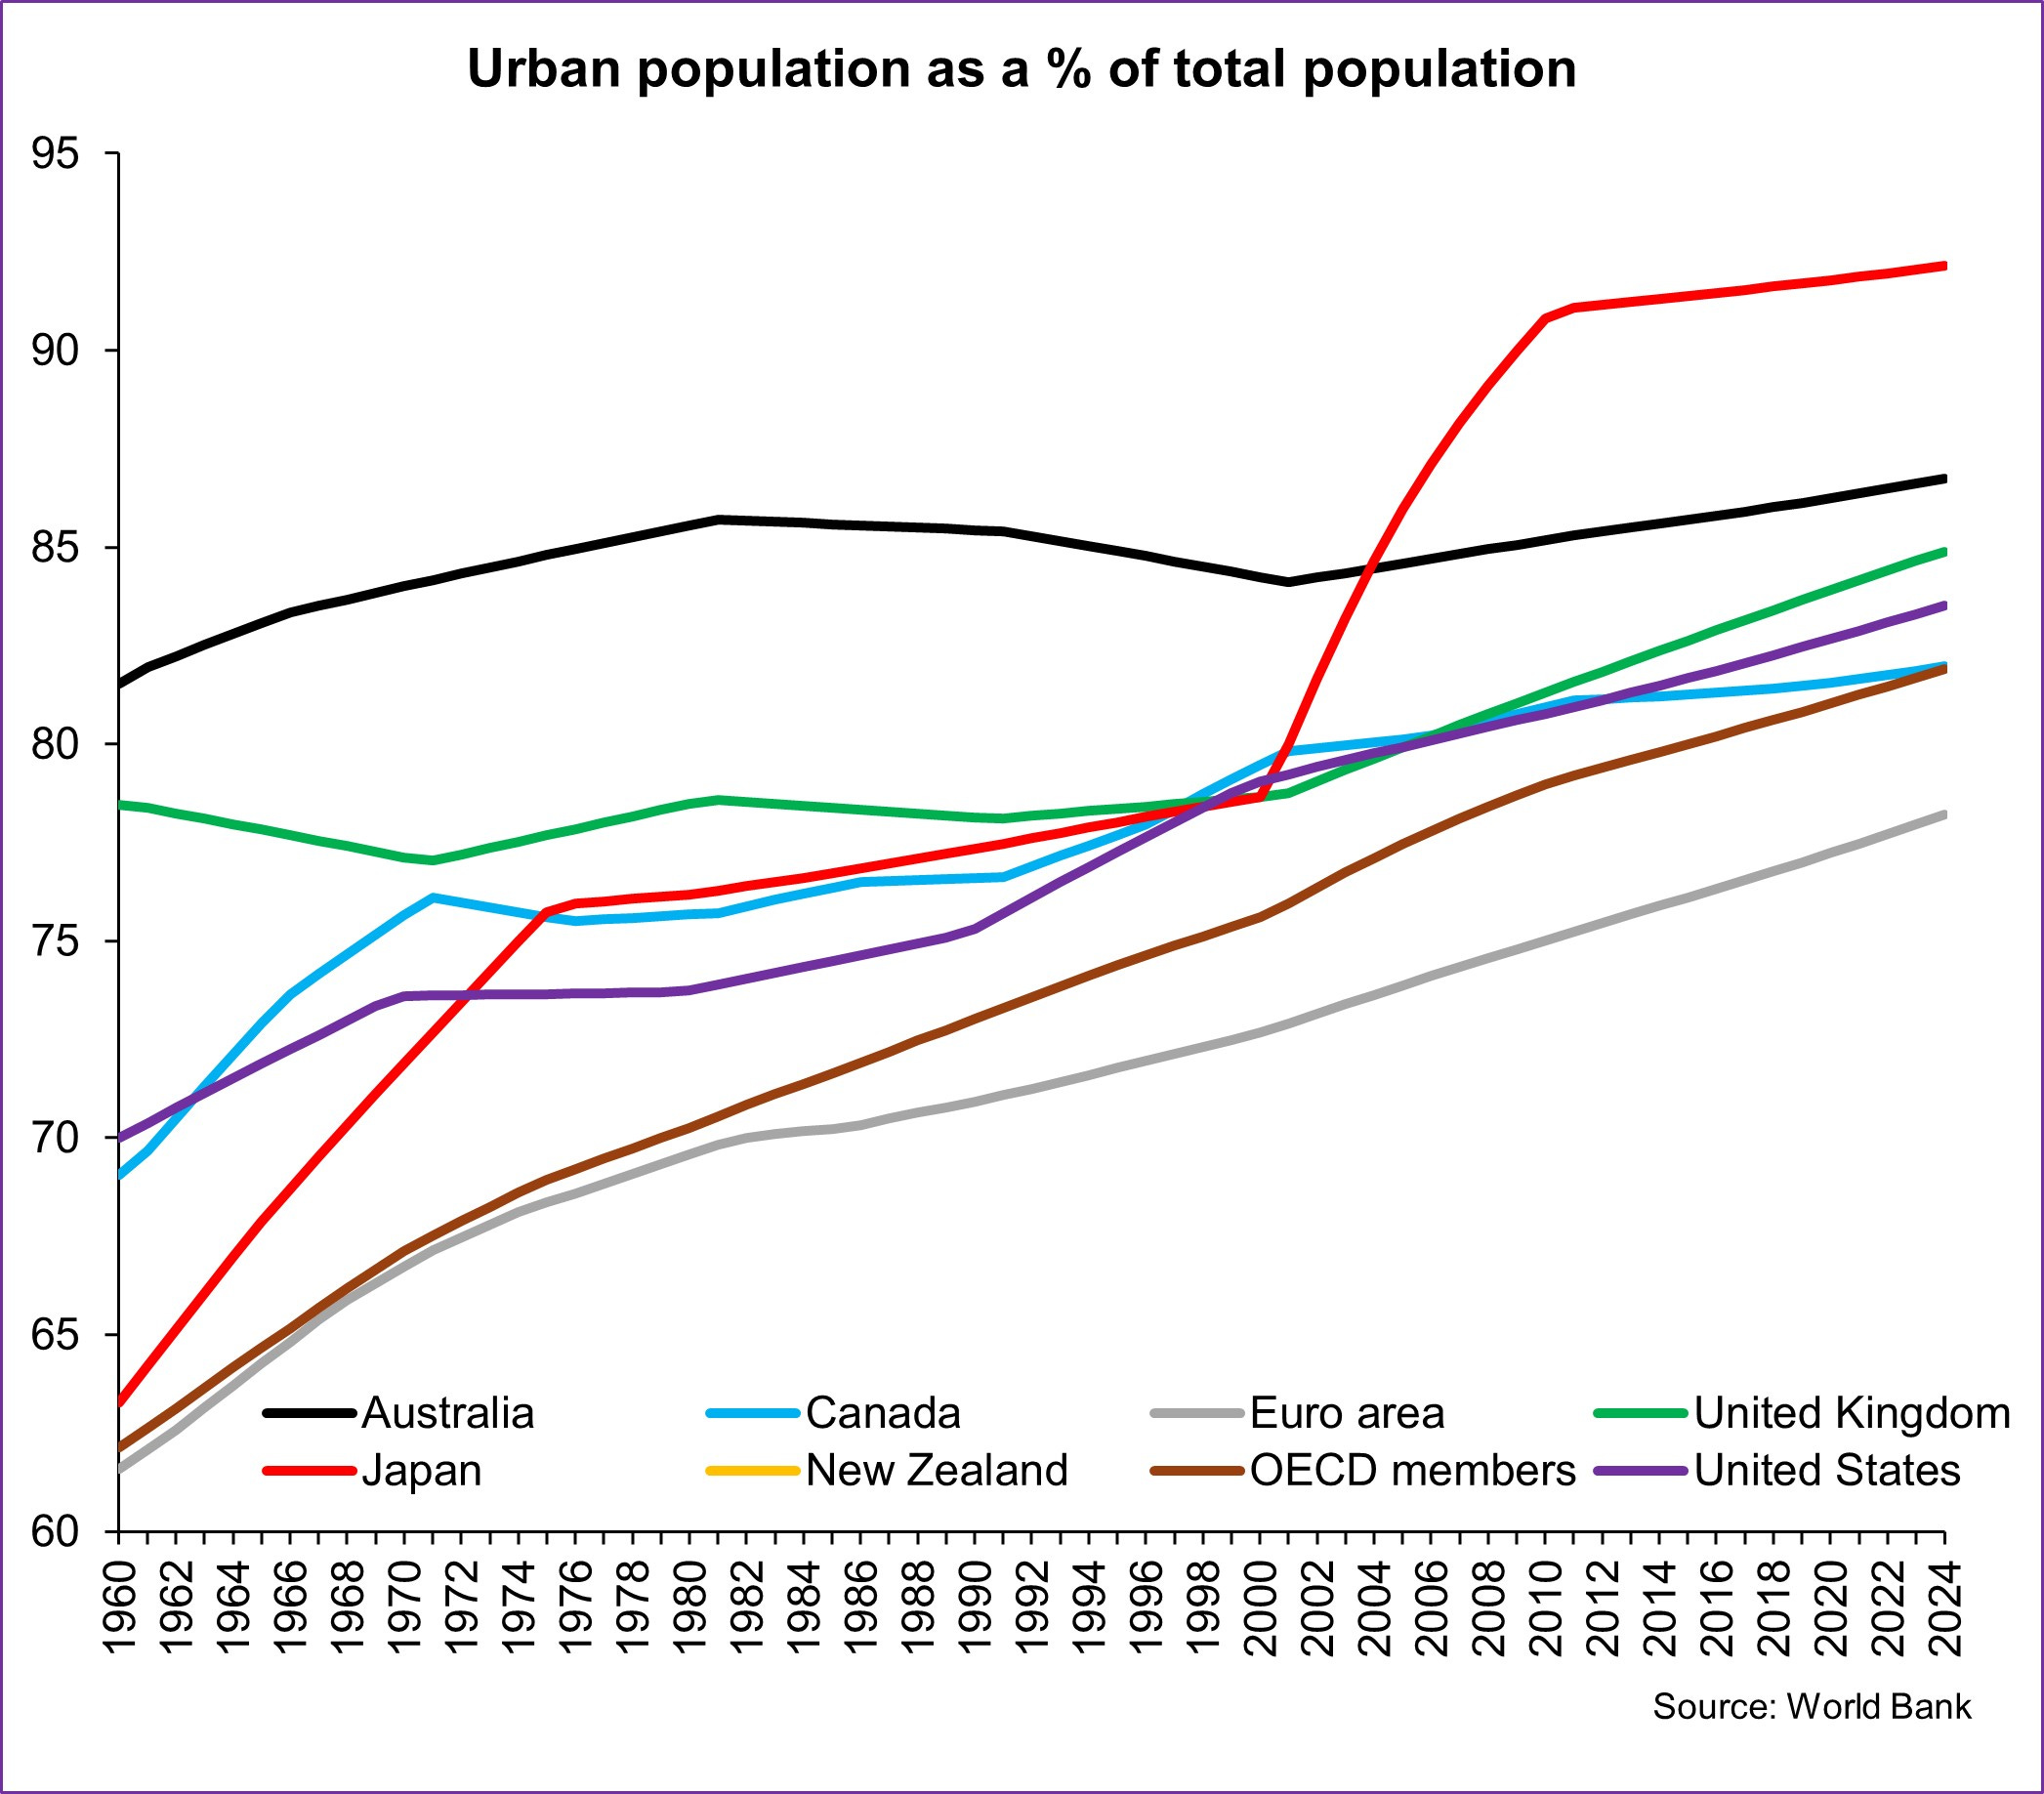
Across the countries detailed in the chart above, only Japan (92.13%) has a higher share of its population living in areas. Across OECD member countries, the urban population makes up 81.91% of the total population.

What does the highly urban population mean? In a country with a relatively low population base such as Australia and one in which we largely live in a handful of larger cities, it means there is significant competition for resources in these cities, which of course includes housing.

Residents of the major cities compete heavily for the best housing locations which increases the price of these properties. Supply of new housing in many of these areas is significantly constrained. Both by policy choices to limit new development and by preferences of existing residents to oppose new development (especially higher densities) which escalates the cost of housing.

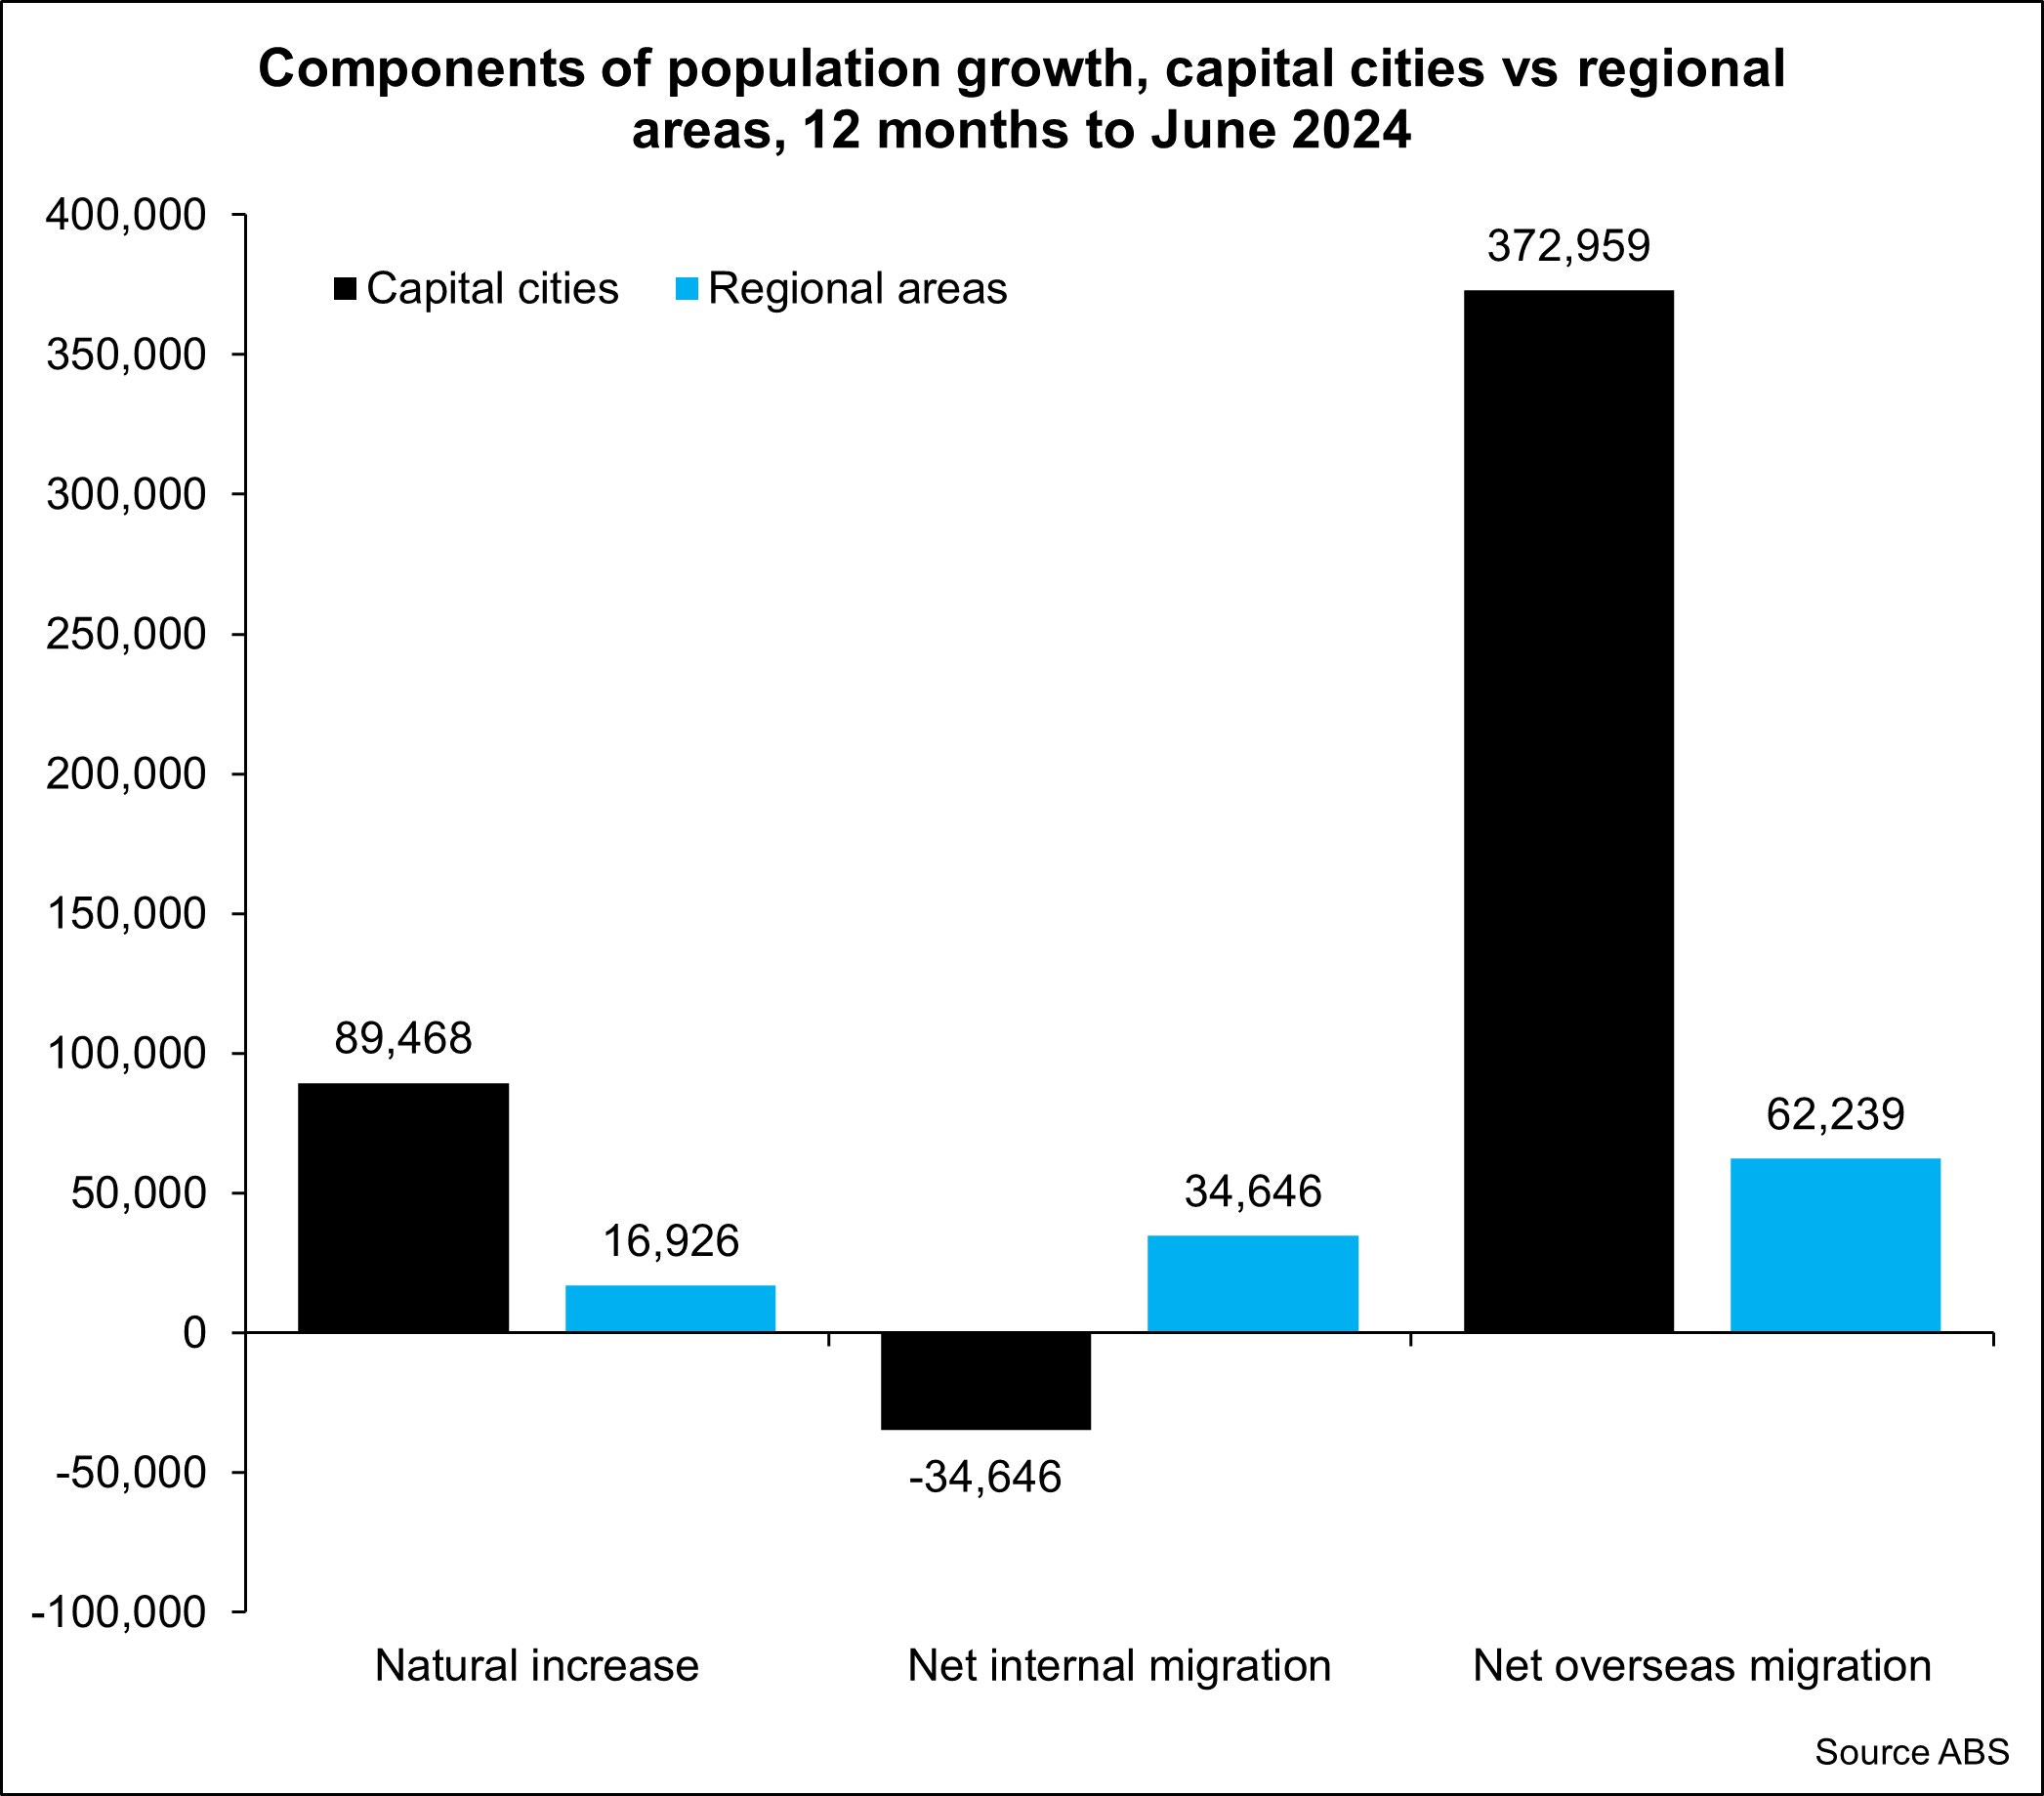
This urbanisation is not new, but it is increasing. The other point to note is that with our high rate of net overseas migration, most migrants also settle in a capital city, so it increases demand for housing and resources in urban areas. It should be noted that some non-capital city markets are also considered urban areas (think places like the Gold Coast, Geelong, Wollongong).

With more Australians choosing to live in urban areas and a majority of migrants also choosing to settle in these urban areas (which is a long-standing trend) the competition for the constrained supply of housing leads to higher housing prices.

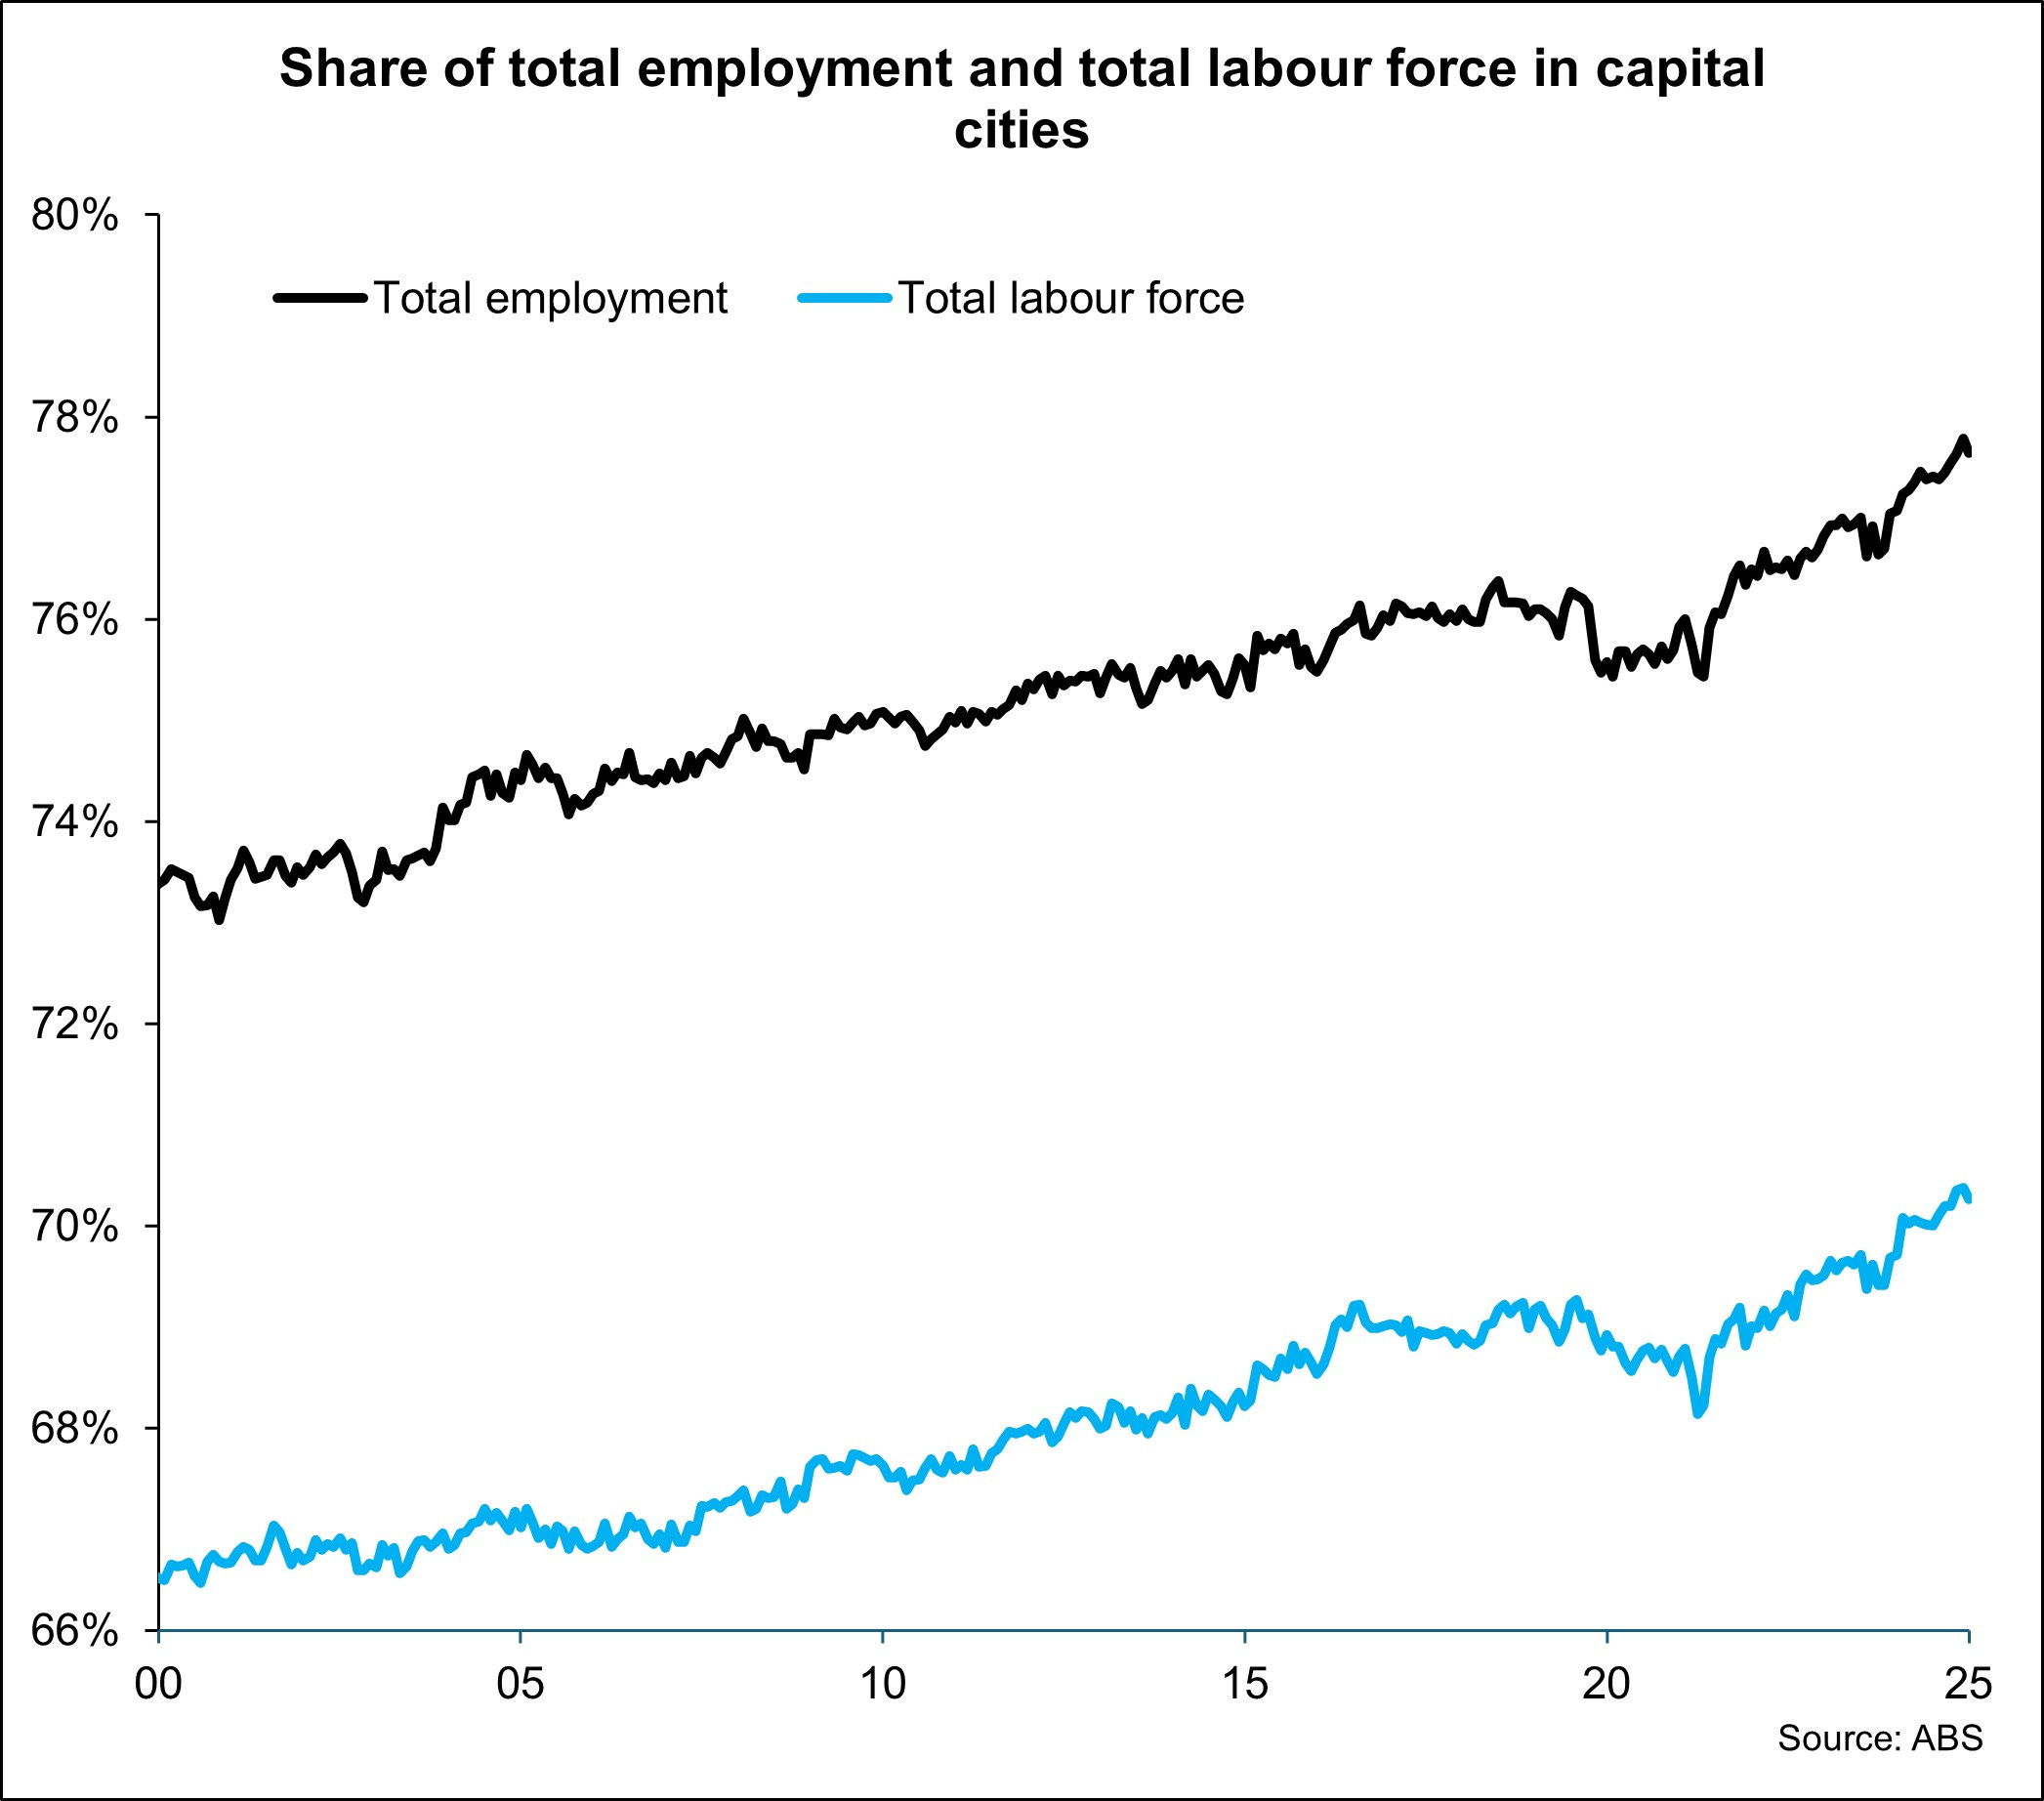
Unfortunately in Australia employment opportunities outside of the major urban areas are much less abundant. As a proportion of total employment and total labour force, capital cities have been seeing their share of both rise over time. Despite lower housing costs in most non-urban areas, the lack of employment opportunities is a significant deterrent to people moving to these areas.

Even the smaller capital cities miss out to some extent. As at June 25, 46% of total employment was in Sydney and Melbourne and 41.8% of the total labour force was in these two cities, which account for around 40% of the national population. Employment opportunities are limited outside of the largest cities, thus making these areas less desirable unless you can work in a major capital city job but do so remotely.

Population growth and migration trends fuelling demand

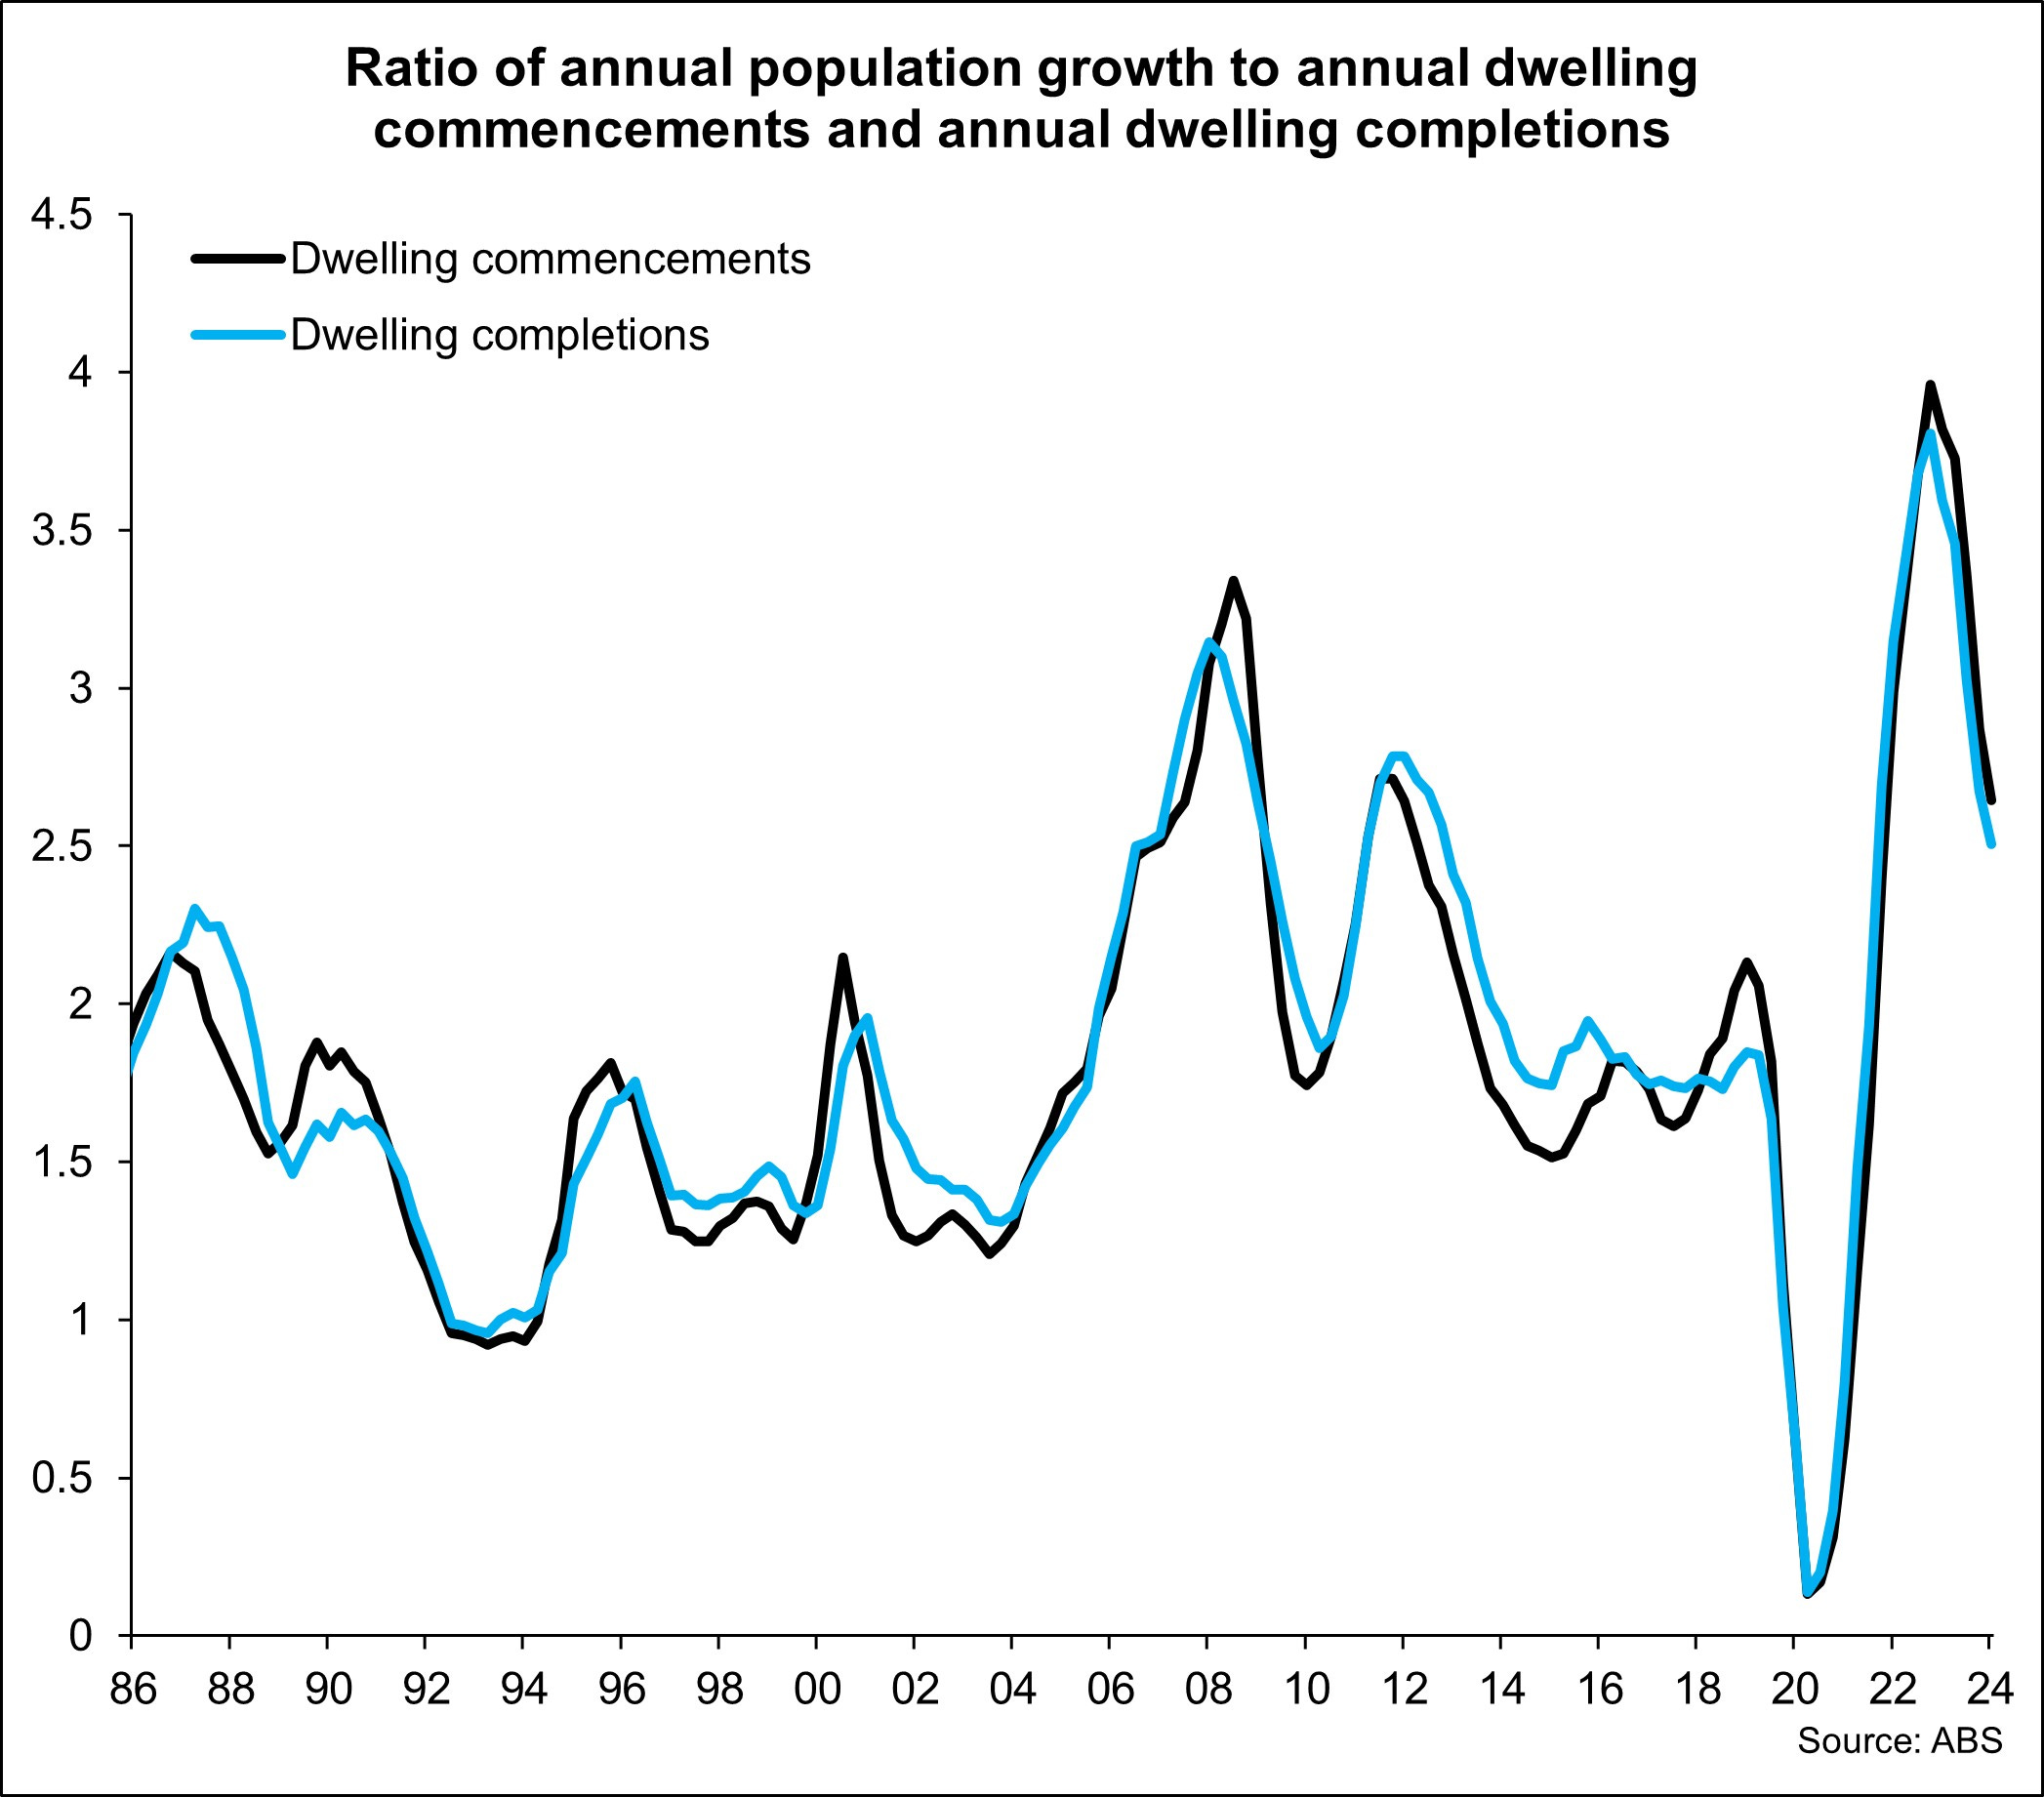
When you have a growing population, you need to also be growing housing stock at a suitable rate to cater to that population growth. While Australia did see a strong supply response to a lift in population growth from 2009 onwards, this has not been the case since population growth surged post-pandemic.

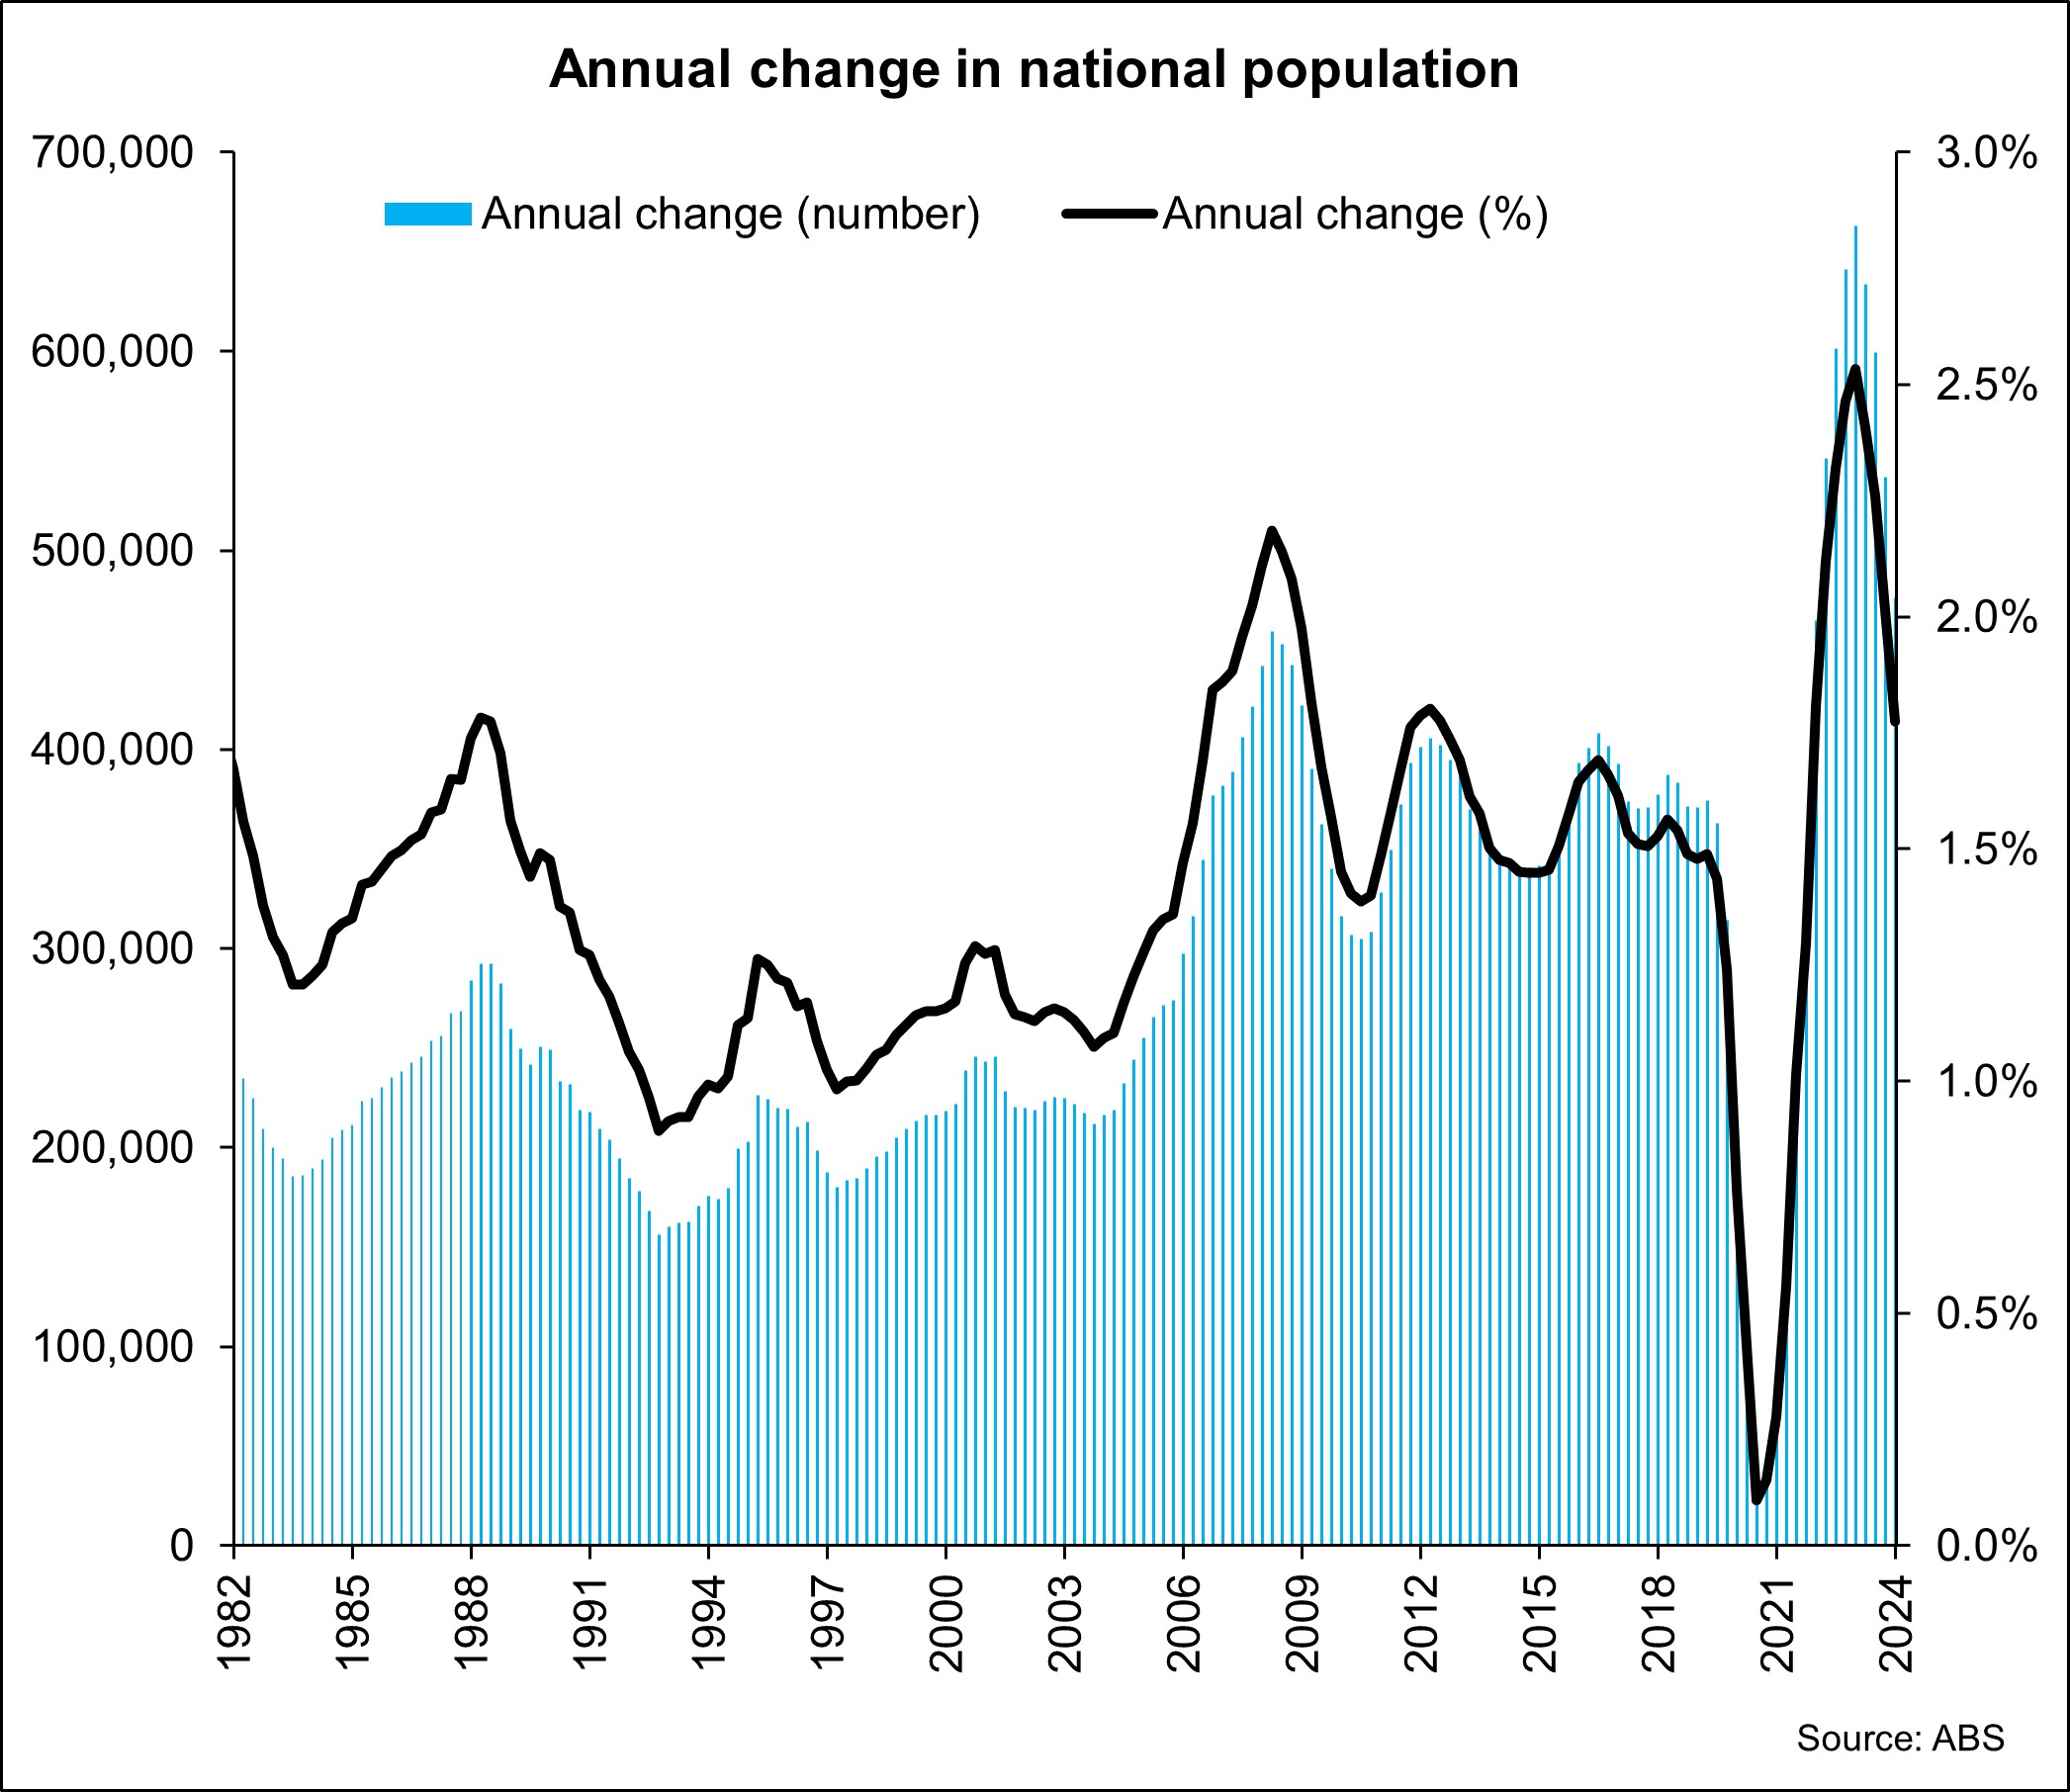
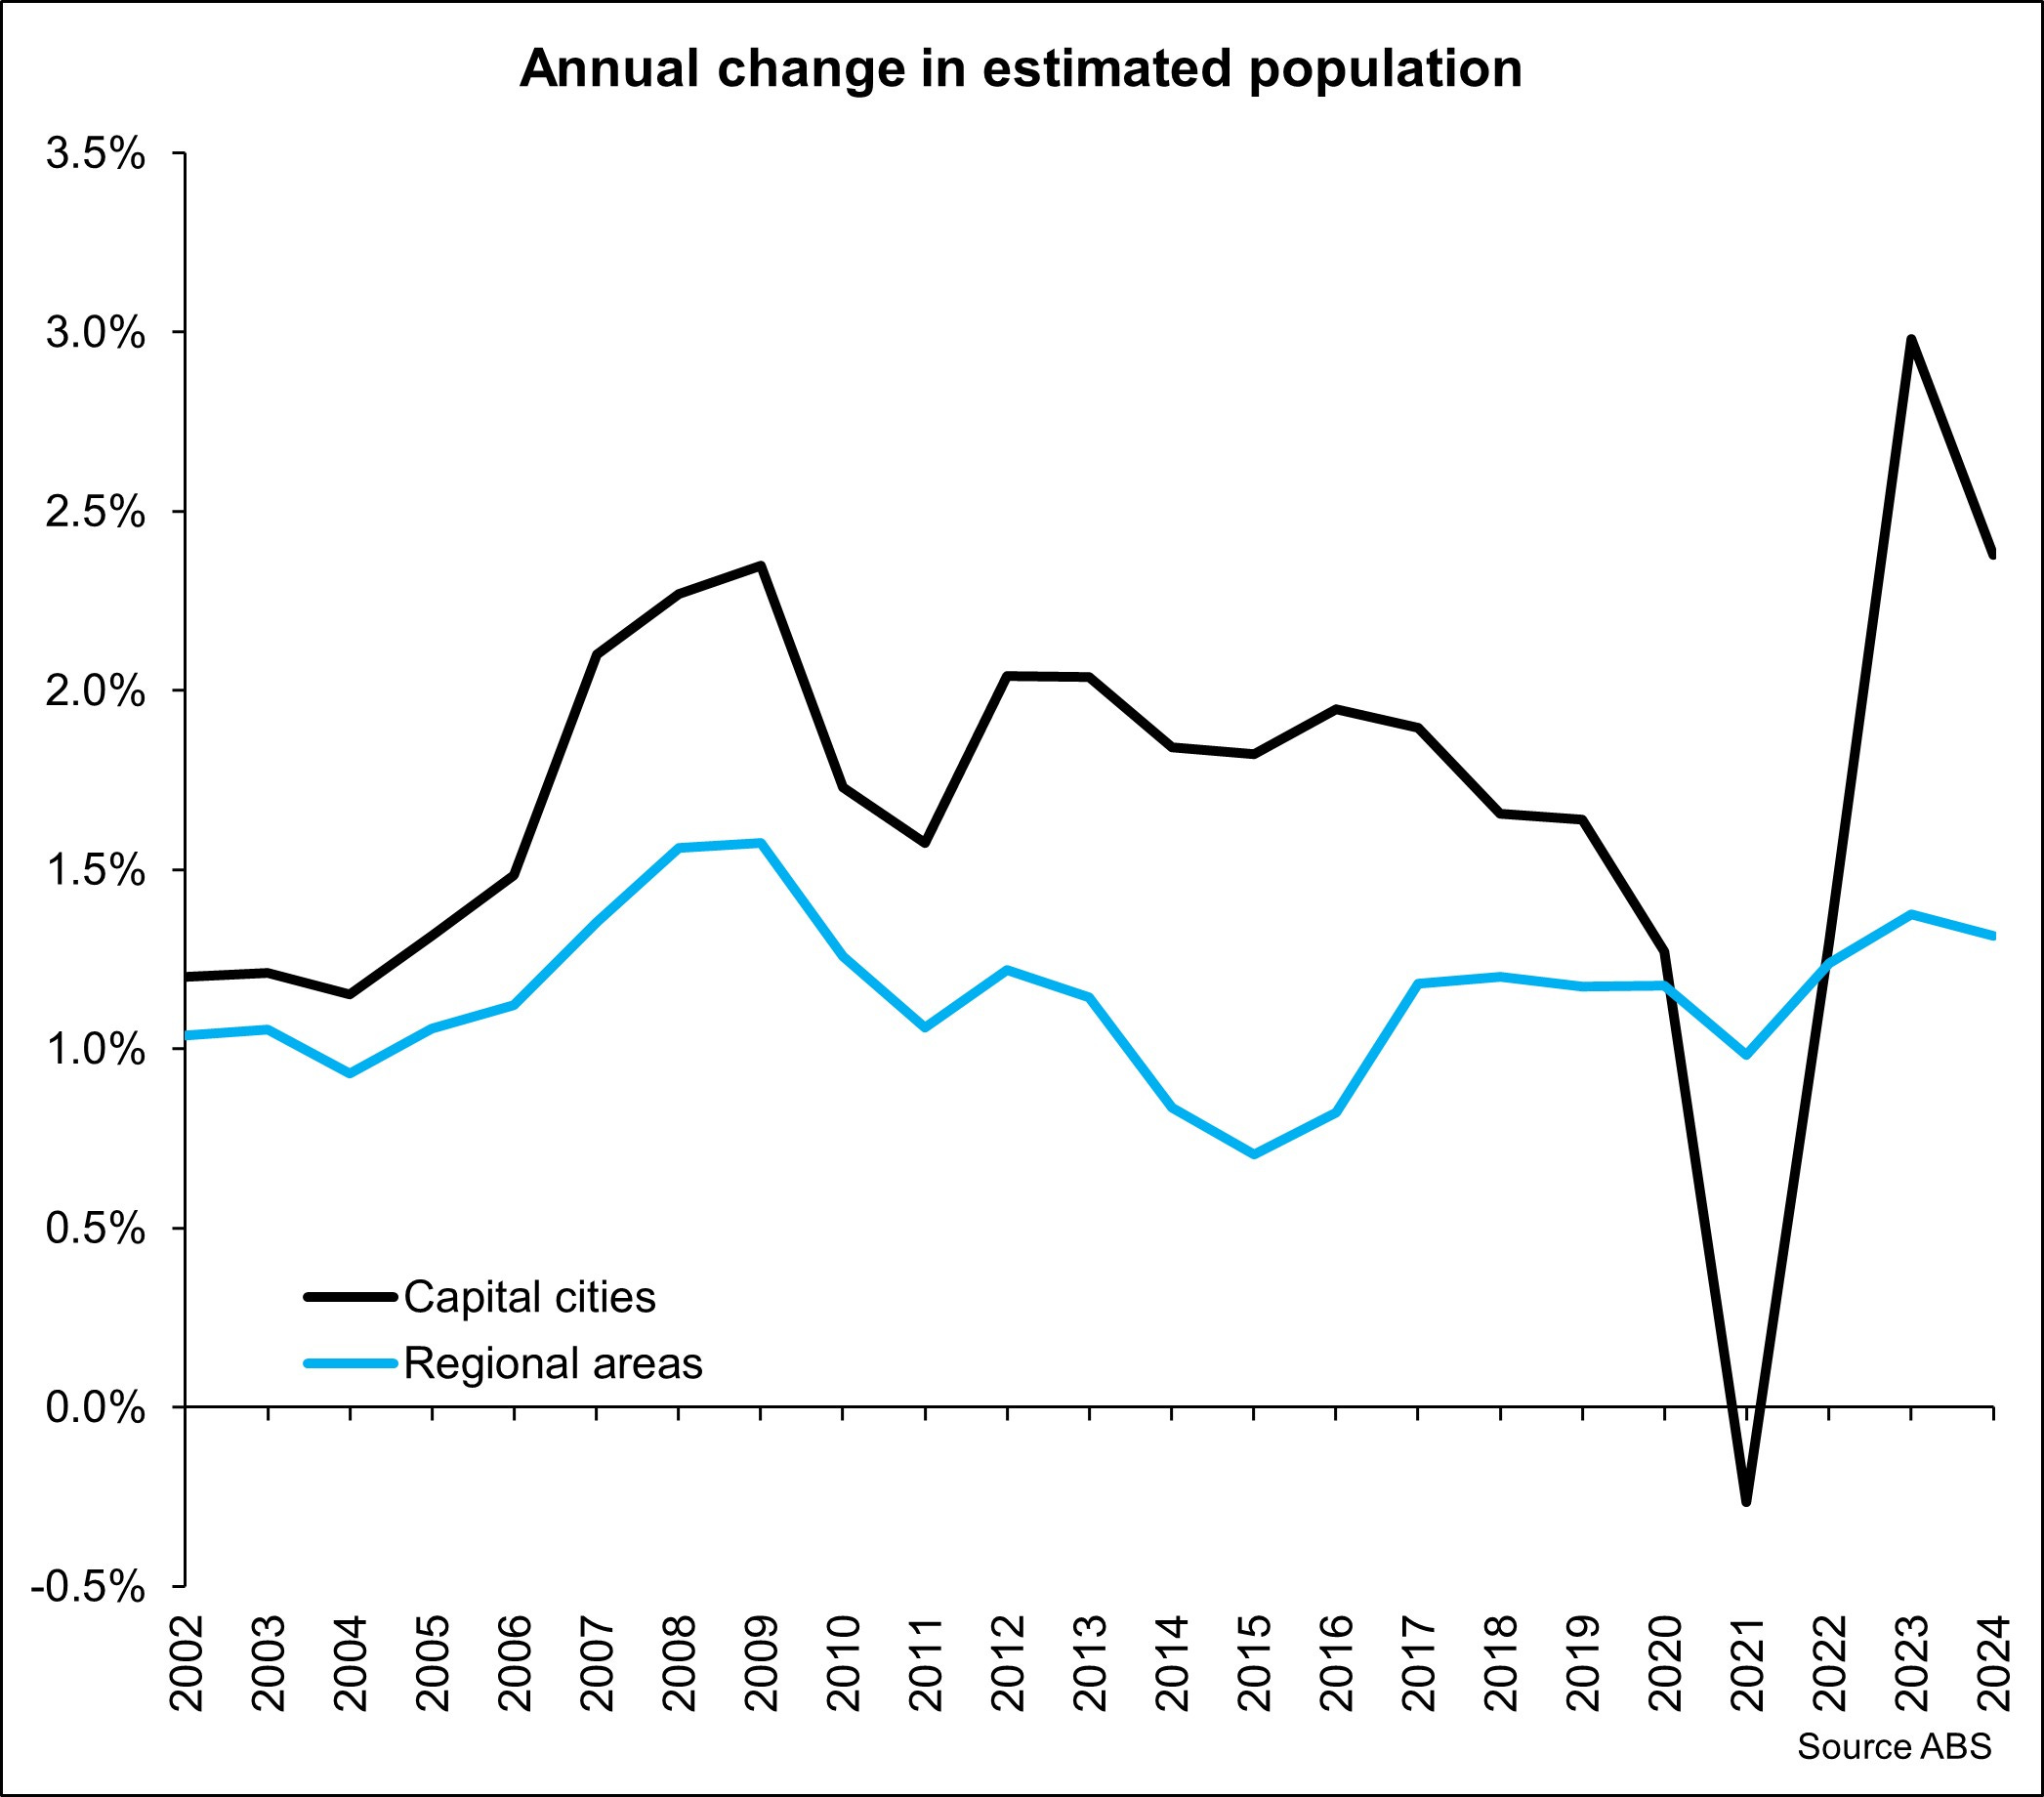
Australia has been running an elevated rate of population growth since around 2007 and over the past few years we’ve seen record-high levels and rates of population growth. This has occurred at a time in which natural increase (births minus deaths) has been trending lower, with net overseas migration the key driver of the increase in population growth.

Having a high level of population of itself is not necessarily a problem. But it becomes a problem when the investment in infrastructure and housing doesn’t keep pace with this growth which has been the experience recently in Australia.

Even though Australia had very high rates of population growth through the mid to late 2010s, we were largely building sufficient housing to cater to that population growth which was reflected in fairly stable rents and moderate home price growth over that period.

Housing supply is inelastic, which means that it isn’t effectively able to respond to rapid changes in demand, particularly a rapid increase in population growth. This has been the experience since the end of 2022 with population growth lifting substantially and supply unable to effectively respond which has led to higher rents and higher home purchase costs.

Population growth fuels demand for housing and if it isn’t properly managed and planned it can lead to surges in housing costs such as those experienced in 2008 and experienced again since 2022. This is especially the case when the increase in the population is being largely driven by migrants who form new households as opposed to natural increase which sees babies join existing households.

High housing costs can also contribute to a more muted supply response. Most housing in Australia is built to be sold rather than built to be rented. The impact of this is that most new housing only gets constructed once there is sufficient presales to access finance to construct. High housing costs overall and the surge in construction costs over recent years have led to a larger than normal premium for new homes. As a result of these conditions, less new housing being built as presales targets for financiers are harder to achieve as many buyers have preferenced purchasing cheaper established alternatives.

The lack of incentives to make excess housing available and a lack of incentives for property owners to right-size.

These are really two drivers, but they essentially complement one another. It seems an unideal situation where some people have multiple homes while others don’t have any homes. The latest Census in 2021 revealed that if we just compare the number of bedrooms in the country to the number of people we have more than enough bedrooms in Australia to cater to our population, it is a case that the right people aren’t utilising the right homes.

The Census shows the number of bedrooms in occupied private dwellings. If we use that data and assume a studio or bedroom apartment is one bedroom and that dwellings with 4 or more dwellings have only 4 bedrooms there was 27,821,418 bedrooms nationally for a population of 25,422,788 persons.

Most couples share a bedroom, and we know there are plenty of 5-bedroom houses out there so there is clearly more than enough bedrooms to cater to our population. These excess bedrooms reflect the fact that many Australians are living in homes which are larger than they need with extra rooms used for guests, as storage or studies.

There’s nothing inherently wrong with having spare rooms but the desire to have more space than we need contributes to our high housing costs.

Furthermore, there are many couples that no longer have dependents living with them that are in houses much bigger than they need. This makes sense, people don’t want to move out of family homes and a larger home is likely to increase in value more than a smaller one but we should consider ways in which we can encourage people in homes that are larger ones than they need to move into more appropriate accommodation freeing these properties up for those that need to access more space.

National obsession with property

This is my final reason for why housing is expensive in Australia, and it is a bit harder to quantify with statistics. Just speak to your family and friends and many conversations will drift into a discussion about housing highlighting that many Australians are obsessed with residential property.

This obsession plays out in several ways.

Firstly, as the value of our home increases we feel wealthier. However, if we want to move home whilst the value of the current property has increased, the next property is typically also more expensive, so we are taking on more debt to upgrade.

It also plays out in the desire of many Australians to own investment properties or second homes which fuels more demand for housing and can lead to higher prices.

Finally, this obsession tends to lead to people being somewhat unhappy with their current housing and constantly wanting to upgrade into something else which will typically be more expensive. We also want to be in the right school zones or in the right suburbs and plenty of people are willing to pay to do so, driving up demand and prices.

In conclusion

There are many factors which have conspired to drive up housing costs. I’d really like to hear what you think are the main drivers or if I have missed any.


Cameron Kusher is Director at Kusher Consulting. He has more than 20 years' experience in the Australian property sector and regularly shares his views on Oz Property Insights, from which this article has been republished, with permission.


14 Comments
GeorgeB
August 08, 2025

If you compare the average mortgage rate in 1990 (17%) to the average mortgage rate in 2024 (7%) you get a ratio (17/7=2.4) which is suspiciously close to the ratio (11.8/4.6=2.56) of median incomes to purchase a median house in 2024 (11.8) to median incomes to purchase a median house in 1990 (4.6). This suggests that the decline in housing affordability is almost fully accounted for over the same period by the increase in borrowing capacity as interest rates have trended lower. Hence there is no need to look to other scapegoats such as immigration, negative gearing or the CGT discount.

Dudley
August 08, 2025

"suspiciously close":

Close as nose on face:

Google AI: 'The median household income to home price ratio in Australia varies by source, but recent reports suggest a national ratio between 8.0 to 9.7 times the median dwelling value as of late 2024 and early 2025.'

Mort-gage payment, 20% equity, as % of household median income:

1990:
= PMT(17%, 25, 80% * 4.6, 0)
= 63.82%

2024:
= PMT(7%, 25, 80% * 9.3, 0)
= 63.84%

Dudley
August 08, 2025


"suspiciously close":

Close as nose on face:

Google AI: 'The median household income to home price ratio in Australia varies by source, but recent reports suggest a national ratio between 8.0 to 9.7 times the median dwelling value as of late 2024 and early 2025.'

Mort-gage payment, 20% equity, as % of household median income:

1990:
= PMT(17%, 25, 80% * 4.6, 0)
= 63.82%

2024:
= PMT(7%, 25, 80% * 9.3, 0)
= 63.84%

Victor Clarke
August 08, 2025

A factor most people miss in this discussion is age at "settling down". 30 years ago, most people married and "Settled down" in their mid 20s. With the increase in women working (good thing) we also saw a trend towards delaying "settling down" into early - mid 30s. There is nothing wrong with that - however from a housing perspective they are now competing with other people in their early - mid 30s for that first home. Combined with double incomes, that means they are competing with couples with far higher incomes = far higher borrowing capacity = far higher house prices.

DougC
August 08, 2025

Is there also an additional factor to those listed in the article ?. In previous generations, children stayed with their parents until they married, then the married couple moved into their own home. Now children leave home when single, each one occupying a home. Both of my sons left home as soon as they finished university, and were still single, and moved into their own flats; most of their friends (male and female) did the same. That social trend required a lot more dwellings than were required in previous generations, and left a lot more spare rooms in parents houses.

CC
August 08, 2025

children leave home now when single ?? things have changed....
none of my 3 adult sons can afford to move out of home even if they could actually find something available and I doubt they'll be able to before their late 20's the way things are in the market.

AlanB
August 07, 2025

Also add:
- cost of overall housing construction has risen due to higher labour and material costs. from timber to taps ;
- quality of housing and features is now far superior to what was acceptable in the 90s and earlier. Compare a first home owners house and expectations then and now. Higher quality features = higher prices.
- governent regulations and planning requirements, often driven by lobbyists, has pushed up prices, eg energy efficiency ratings, insulation etc.
- migration from countries with traditions of helping their children become established has raised the purchasing power of first home buyers, pushing up house prices and also put pressure on more/all parents to become the bank of M&D. Whereas once an average income was enough, now you need more. So kids, be nice to M&D.

Paul Muscroft
August 07, 2025

The wealth effect of property is a delusion that we Australians (and the populations of most Western Countries) have fallen for hook, line and sinker. The compound annual growth rate for property you highlight - 7.8% - looks impressive until you compare it to the growth in M2 money supply over the same period which is approximately 10%. That is not surprising as money is created by the banks in the first place. I'm surrounded by suburbs of beautiful family homes that are now lived in by aging couples who have absolutely no intention of moving out (and why should they) and when they do pass, their homes will be far too expensive for an average family to afford. I really don't know what the answer is - but I hope it isn't the appallingly built apartments with endless defects that are so common now.

Malcolm Moore
August 07, 2025

No mention of the tax incentives driving house prices? What we need is a social contract that says if you want the tax payer to subsidise your investment then that property MUST be rented out on a long term lease. No short term, or holiday rentals, or empty homes should be eligible for negative gearing or capital gains tax concessions.

John Abernethy
August 07, 2025

Thanks Cameron - great charts and sound analysis.

Be good if the ABS added the level of mortgage debt in the chart tracking the value of residential buildings and land. Then we could see a "net value" of residential property.

Further, a chart that tracks the percentage of households who have mortgages. Then a specific chart of the mortgage debt against the value of the geared property (security ratio or LVRs).

The problem is that averages hide real problems and particularly the leveraged part of the mortgage market.

Hence the focus by the RBA on mortgage stress for young households that necessitates a low cash rate setting.

John
August 07, 2025

There are a significant number of houses/units that have been purchased by overseas investors which sit unoccupied riding the appreciation in their investment.
There are laws to prevent this?

Andrew Smith
August 07, 2025

Interesting analysis but misses key driver of population growth and impact on property.

Media, politicians and commentators draw a direct correlation and causation between house prices &/or population growth with the NOM Net Overseas Migration or border movements.

The latter is dominated by international students on temporary visas who cannot and do not purchase property, or houses in particular?

The NOM is simply medium term border movements or marginal data noise, but the long term driver is US, mass of middle aged and older Australians and permanent residents.

Includes silent gens and boomer 'bomb' living longer, hence, we are compounding in the data, driving population growth till mid century?

Further, median house values have stagnated over the past decade......apartments worse.

Dorian
August 07, 2025

Excess bedrooms in the home - needed more and more. It's likely that many more people nowadays use a bedroom as an office nowadays with the rise in WFH availability. Also the adult kids cant afford to buy where they grew up - when they visit Mum and Dad from distance they will likely need a place to sleep over. We are just 2 in a 4 bedroom home. One is a full-time office for a WFH business - the others get a regular work out from the kids and their families. No plans to sell anytime soon.

John
August 07, 2025

If it is a full-time office, art studio, gymnasium or hobby room, it is not a bedroom. But I suspect the ABS is counting it as such. We've done the downsize. We did so in part to leverage the curiously named "downsizer contribution", for which there is no requirement to actually downsize. We even looked to upsize, but did not want to use any super to do so. Happy to downsize again if the ATO wants to allow a 2nd bite of the super contribution scam. Oh, and waive the CGT liability, as we rented this joint for years before downsizing into it to minimise CGT when we croak.


Leave a Comment:

RELATED ARTICLES

Why we can't separate housing policy from migration policy

A housing market that I'd like to see

Financial pathways to buying a home require planning

banner

Most viewed in recent weeks

Raising the GST to 15%

Treasurer Jim Chalmers aims to tackle tax reform but faces challenges. Previous reviews struggled due to political sensitivities, highlighting the need for comprehensive and politically feasible change.

100 Aussies: seven charts on who earns, pays, and owns

The Labor government is talking up tax reform to lift Australia’s ailing economic growth. Before any changes are made, it’s important to know who pays tax, who owns assets, and how much people have in their super for retirement.

Here's what should replace the $3 million super tax

With Div. 296 looming, is there a smarter way to tax superannuation? This proposes a fairer, income-linked alternative that respects compounding, ensures predictability, and avoids taxing unrealised capital gains. 

9 winning investment strategies

There are many ways to invest in stocks, but some strategies are more effective than others. Here are nine tried and tested investment approaches - choosing one of these can improve your chances of reaching your financial goals.

Chinese steel - building a Sydney Harbour Bridge every 10 minutes

China's steel production, equivalent to building one Sydney Harbour Bridge every 10 minutes, has driven Australia's economic growth. With China's slowdown, what does this mean for Australia's economy and investments?

With markets near record highs, here's what you should do with your portfolio

Markets have weathered geopolitical turmoil, hitting near record highs. Investors face tough decisions on valuations, asset concentration, and strategic portfolio rebalancing for risk control and future returns.

Latest Updates

Retirement

The best way to get rich and retire early

This goes through the different options including shares, property and business ownership and declares a winner, as well as outlining the mindset needed to earn enough to never have to work again.

Shares

Boom, bubble or alarm?

After a stellar 2025 to date for equities, warning signs - from speculative froth to stretched valuations - suggest the market’s calm may be masking deeper fragilities. Strategic rebalancing feels increasingly timely.

Property

A perfect storm for housing affordability in Australia

Everyone has a theory as to why housing in Australia is so expensive. There are a lot of different factors at play, from skewed migration patterns to banking trends and housing's status as a national obsession.

Economy

Which generation had it toughest?

Each generation believes its economic challenges were uniquely tough - but what does the data say? A closer look reveals a more nuanced, complex story behind the generational hardship debate. 

Shares

Is the iPhone nearing its Blackberry moment?

Blackberry clung on to the superiority of keyboards at the beginning of the touchscreen era and paid the ultimate price. Could the rise of agentic AI and a new generation of hardware do something similar to Apple?

Fixed interest

Things may finally be turning for the bond market

The bond market is quietly regaining strength. As rate cuts loom and economic growth moderates, high-quality credit and global fixed income present renewed opportunities for investors seeking income and stability. 

Shares

The wisdom of buying absurdly expensive stocks (or not!)

Companies trading at over 10x revenue now account for over 20% of the MSCI World index, levels not seen since the dotcom bubble. Can these shares create lasting value, or are they destined to unravel?

Sponsors

Alliances

© 2025 Morningstar, Inc. All rights reserved.

Disclaimer
The data, research and opinions provided here are for information purposes; are not an offer to buy or sell a security; and are not warranted to be correct, complete or accurate. Morningstar, its affiliates, and third-party content providers are not responsible for any investment decisions, damages or losses resulting from, or related to, the data and analyses or their use. To the extent any content is general advice, it has been prepared for clients of Morningstar Australasia Pty Ltd (ABN: 95 090 665 544, AFSL: 240892), without reference to your financial objectives, situation or needs. For more information refer to our Financial Services Guide. You should consider the advice in light of these matters and if applicable, the relevant Product Disclosure Statement before making any decision to invest. Past performance does not necessarily indicate a financial product’s future performance. To obtain advice tailored to your situation, contact a professional financial adviser. Articles are current as at date of publication.
This website contains information and opinions provided by third parties. Inclusion of this information does not necessarily represent Morningstar’s positions, strategies or opinions and should not be considered an endorsement by Morningstar.