Register For Our Mailing List

Register to receive our free weekly newsletter including editorials.

Home / 633

Four best-ever charts for every adviser and investor

The long term is Inevitable

Firstly, the short term is unknowable, but the long term is inevitable. The stock market has good years and bad, but over the long term there is only one trend and it is up. Despite this being so obvious, I continue to be astounded at how investors behave during ‘bad’ years.

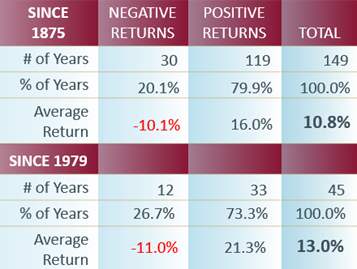
Calendar Year 2024 marked the 149th year of trading on the Australian Stock Exchange. That enormous amount of data provides the clearest guide to anyone willing to learn. During this period, the market (dividends plus capital growth) has risen 119 years and declined 30 years. So 79.9% of the time, the market rises. One in five years on average, the market declines.

Source: Katana Asset Management

When the market rises, it does so by an average of 16.0%, and when it declines the average is minus 10.1%. When combined, we see that over the past 149 years, the market has averaged a return of 10.8% per annum.

Since we have become more sophisticated and introduced the Accumulation Index in 1979, the data points to an even stronger outcome. Over the 45 years since 1979, the market has risen by an average of 13.0% per annum. And this is despite some large market dislocations, including the 1987 Stock market crash, the 1997 Asian Financial Crisis, the GFC and the fastest crash on record, Covid-19.

Volatility is the price you pay for a seat at the table 

But of course in the short term – from year to year – markets are volatile.  

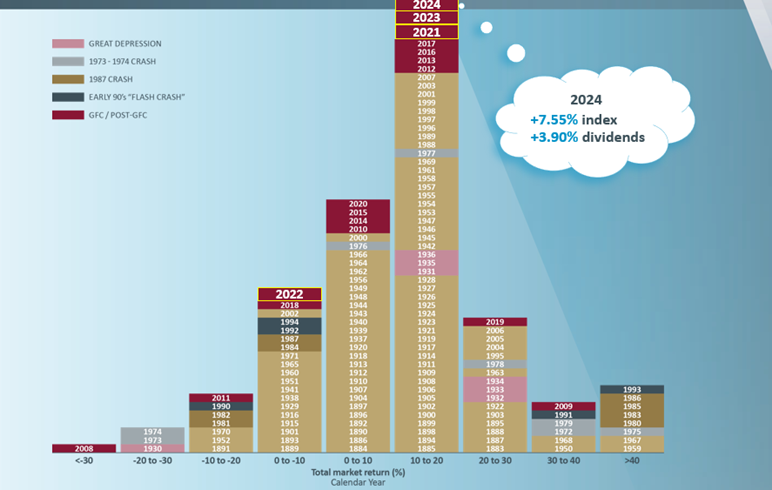
We’ve all seen this distribution curve below – perhaps numerous times. But I suspect that many investors have failed to grasp the most important aspect.

Source: Katana Asset Management

And that put simply is that crashes are inevitable; be ready and don’t panic at the bottom (the only time to panic is at the top).

Case in point, there has only been one (calendar) year in the ASX’s 149 year history, where the market fell by 30% or more – 2008. But if you panicked and sold during that crash, you would have missed an extraordinary recovery.  In 2009 the market was up by 39.6% and rose in 11 of the 14 years following the crash, including by 18.8% in 2012, 19.7% in 2013 and 24% in 2019. 

One in 5 years you will wakeup and question why you invested in the stock market! Know thyself. Understand history.  Forewarned is forearmed.

If there is a better table than this, send it to me…

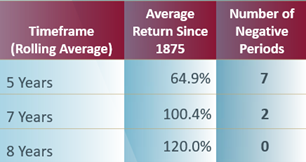
To better understand how the market behaves over different timeframes, we can break the data into rolling periods.  For example, a rolling 5 year period, is the average return over every 5 year period since 1875.

What this table demonstrates is rather extraordinary.

Source: Katana Asset Management

If you were to invest your money in the ASX (index), turn off your screen, go away and come back in 5 years’ time, then on average you would have a 64.9% return, and there would have been only 7 occasions out of the 145 rolling 5 year periods where you would have a negative return. 

If you were to invest your money in the ASX (index), turn off your screen, go away and come back in 7 years’ time, then on average you would have a 100.4% return, and there would have been only 2 occasions where you would have a negative return. 

But even more remarkably, if you were to invest your money in the ASX (index), turn off your screen, go away and come back in 8 years’ time, then on average you would have a 120.0% return, and there would have been NO occasions on record where the dividends and capital growth would have been negative. 

There is only one long term trend, and it is up.  

Wait…here’s a better table!

Source: Katana Asset Management

We’ve literally compiled hundreds of tables over the past 3 decades, and this is our best. There are 2 critical points. 

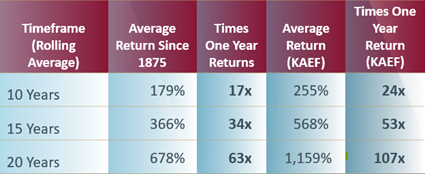
Firstly, we see even more dramatically, the true power of compounding. Compounding for 10 years produces the equivalent of 17 one-year returns. Impressive. But compounding for 20 years produces the equivalent of an extraordinary 63 one-year returns! 

And finally, the importance of generating an extra margin.  As an example, the Katana Australian Equity Fund (KAEF) has generated close to an extra 2.7%+ per annum net of all fees for nearly 2 decades (note past performance is no guarantee of future performance). If we take a 2.7% per annum margin and compound it over 10, 15 and 20 years, then the effects are mind-boggling. Over 10 years, it is the equivalent of 24 one-year returns. Over 20 years, this generates the equivalent of 107 one-year returns. Difficult to believe, but true. Generating an extra 2.7% per annum (net) generates the equivalent of 107 one-year returns versus 63 one-year returns without it.


Romano Sala Tenna is Portfolio Manager at Katana Asset Management. This article is general information and does not consider the circumstances of any individual. Any person considering acting on information in this article should take financial advice. 

Past performance is not a guarantee of future performance. Stock market returns are volatile, especially over the short term.


  •   15 October 2025
  • 23
  •      
  •   
23 Comments
Brent
October 17, 2025

I note that the All Ords was at 6,723 on 19 October 2007. The All Ords made it to break-even 15 years later (noting it was at 6,678 on 30 September 2022). The story portrayed in the article doesn't identify lengthy periods of negative returns such as this + What would $1,000 invested in 2007 be worth in 2022? This 15 year period was massive for wealth destruction.

8
Jeremy M
October 17, 2025

Brent, your stats don't include dividends ... a big miss.

6
Kevin
October 17, 2025

Always the same problem Brent.Cherry pick data ( the data is obviously wrong). Make up nonsense,invent your own facts.The simple concept of compounding is far beyond the ability of most people. You is used in the plural sense ( or use they)
When they are not doing their full time job of making up their own nonsense and inventing their own facts,they fill up any spare time travelling around in time machines and trying to come out with dumber things than that .

So we can all look back ( and learn that the only lesson history teaches us etc etc etc)
Let's look back. The year that you mention 2007 ( always pick the top of the market for faulty data ).
So 30/6/07
ANZ $28.99 each.
CBA $54.92
NAB $40.80
WBC $25.65
Throw in WES $45.70.
While we look back the best performer there.is obviously CBA.Further looking back then make up nonsense. If you buy these strange things called shares you lose all your money. So the price rising from ~ $55 to ~ $170 is undeniable proof that you've lost a lot of money Perhaps it is wise to refer to time machines at this point.
So for most of that time I was either using dividends to reduce debt,or retired and living off the very good dividends ,and paying tax.Excess income went back into the DRP for all of them The only two I recall buying on market were CBA and WES.All capital raisings in WBC,ANZ and NAB were taken up to the full extent. They had a few across those years..

So if I started with 1000 shares in each of those companies in 2007 I've at least tripled the shareholdings in them.That would be 3,000 shares in each of them now.Plus shares in Coles when it was spun out of WES ,leave that to side.

2027 will be 20 years after 2007, don't be surprised if people deny that. All the rubbish they invent over that 20 year period ( while jumping in and out of time machines ) will be the same for the following 20 year period,only dumber.

Romano is correct,people will never understand the simple concept of compounding,and their greatest achievement in life will be avoiding wealth.
Have a good one. Oh, the house I bought a long time has also gone up in price since 2007. We are far far wealthier than we were in 2007 $millions wealthier. Don't be surprised when people deny that.

So the shareholdings in each of those

39
Dudley
October 17, 2025


To ADJust for dividends and corporate actions like share splits:
https://www.marketindex.com.au/asx/stw/advanced-chart

STW is the longest operating ASX 200 index ETF. A little more relevant than accumulation indexes.

Buy high
01/10/2025 81.15
01/11/2007 28.60
Return rate:
= (81.15 / 28.6) ^ (1 / ((DATEVALUE("01/10/2025") - DATEVALUE("01/11/2007")) / 365.25)) - 1
= 5.99%

Buy low
01/10/2025 81.15
02/02/2009 15.56
Return rate:
= (81.15 / 15.56) ^ (1 / ((DATEVALUE("01/10/2025") - DATEVALUE("02/02/2009")) / 365.25)) - 1
= 10.42%

We don't know if STW is currently at a local high or low or whether future performance will be similar or not to the past.

A viable alternative to gambling on shares is saving.

8
Piston Broke
October 18, 2025

$1000 invested 2007 would be $2642 by end of 2024.

5
Disgruntled
October 18, 2025

$1000 invested in 2007 is worth $X now.

What does X buy? Are you really wealthier?

We need many more dollars now than in 2007, inflation/dollar devaluation, however one wants to look at it to buy those same things now.

3
Dudley
October 18, 2025


"Let's look back.":
Better to look forward.

Better still, take the Public Time Machine to some convenient future time and return with that time's share market results.

2
Mart
October 19, 2025

Dudley
October 18, 2025

"Let's look back.":
Better to look forward.

Better still, take the Public Time Machine to some convenient future time and return with that time's share market results.

I don't believe in Time Machine's Dudley and I didn't when I was older

2
Dudley
October 19, 2025


"I don't believe in Time Machine's Dudley and I didn't when I was older":
and when wiser also.

Roderick
October 24, 2025

A table is not a chart.

Dudley
October 24, 2025


"A table is not a chart.":
A graph (Greek ???´fe?? [graphein] 'write / draw') is not a chart (Latin charta 'paper').

Lawrence Barnes
October 16, 2025

Great information. Unfortunately most of the population don't understand this and consider any form of investing risky and therefore choose not to do it. Super is generally there only form of investment and this is mandatory anyway.

8
Paul
October 16, 2025

Not sure how many investors have a 149 timeframe, nor does this mention sequencing risk, nor that fact that when a drawdown occurs, there is a non-linear return requirement to breakeven.....and to top it off, it uses averages.....

7
Mart
October 16, 2025

Fairy nuff ... so what alternative investment would you propose Paul ?

4
Hampton
October 19, 2025

Mart.
GOLD.
An excellent article by Mr Tenna. I wonder what the result would be if he applys the price of gold to his calculation, and not the ASX index
Ham

Maurie
October 16, 2025

No better advertisement for the role of compounding. However, the concept of disconnecting from the world immediately after making an investment although instructive is too simplistic. And this is where I think the root of the problem lies. Compounding is not intuitive to most of us. It requires emotional intelligence to avoid succumbing to the volatility machine, a subject very rarely given much attention in financial literature. A lot of us seem to be caught up with chasing the newest shiniest instrument (e.g. Nvidia, Gold) without stopping to think about the historical context as noted in the article. There will be a certain cohort in the current market that would vehemently argue "100% return in 7 years that's nothing, I could achieve that in one year". We say a little prayer for those rock stars. I would love to see this article reproduced in a calendar year that resembles one of the four outlier years found in the extreme negative tail.

7
Mark Hayden
October 16, 2025

Excellent charts. As a Long-term Investor this is reassuring. These charts, other than ones including KAEF returns, show a patient and passive approach. This supports the asset allocation decisions within my Model. The KAEF returns show a patient but active approach. This supports the specific investment selection part of my Model. In conclusion, there are significant advantages to being a Long-term Investor.

6
Stephen
October 19, 2025

This is the genius of compulsory super for your average Australian. Now that most public offer funds use lifestage strategies as the default option, people’s retirement savings at younger ages benefit from being fully (or close to) invested in the market. By age 60 assuming even an average paying job for 35 years they will be millionaires! Of course by then they’ll need it because the age pension won’t kick in until 70……

1
ROMANO SALA TENNA
October 22, 2025

Some good questions and points raised, but not possible I'm sure you will agree to adequately address in a comment box. I'll endeavour to write a followup piece next month with some thoughts around the 2 themes that dominate many of the comments.

1
Philip Rix
October 22, 2025

Well written article - I enjoyed the way the concepts were been explained by Romano.

However, I also would like a little more explanation as to what "index" figures have been used in the table by the author to ensure I have a greater understanding of the arguements - ASX200? ASX300? All Ords(500)? ASX Accum?

Thank you for the contribution.

1
Sean F
October 19, 2025

Love the data points here..., but I don't know what I'm looking at? What index is being referenced? The market, the ASX (Index) what index? Are dividends included? What accumulation index is referenced?

Also worth noting, you cannot actually invest in an index, and it's pretty hard to buy the whole market, so it's good know to which index is being referred to so readers can possibly look for products linked to the index, or products aiming to outperform it. Is the Katana Fund outperforming a total return index?

Philip Carman
January 01, 2026

I'm going to assume that people reading these articles are among the (say) 10% most informed, experienced and/or interested in investing, 'wealth creation', markets, etc etc...and yet the level of awareness, knowledge and understanding of some very basic concepts is poor. THAT's the problem. In my 40-odd years in the Money Business I found few (even insiders) who had deep, informed and experienced understandings about risk (and its management), biases (and their management!) or even the simple arithmetic of markets and their inability to escape the behavioural traits that always beleagure them and make them so likely to do almost exactly what most believe they won't do! It was only in the 1990s that the Nobel Prize in Economics finally recognised "Behavioural Finance" with a gong, when since Adam was a boy there's really been nothing other than behavioural finance/economics. Economics is about what people do with (theirs' and others') money!! And it's what stops most real people from doing what Messrs Sala Tenna and Whittaker urge - invest and stay in for the long haul. When markets gyrate they upset plans and scare the bejesus out of those who fear loss and so their plans are abandoned, even if only temporarily. I won't go into it now, but I will raise a simple issue that it seems is forgotten (although arguably not important if you use an Index ETF or managed fund) and it's that indices get re-arranged as stocks fall out and new (better?) ones are installed. That skews performance positively, but otherwise can dent the buy and hold thinking... Just sayin'. Good luck in 2026. Here's a tip: set a Stop Loss and Profit Point (the latter is my own invention) on everything you own/buy and re-set every year to your new expectations. On a Stop Loss, sell 100% and retire the balance to the bank for a year; on a Profit Point, sell no more than 35% and immediately re-set tyhe Profit Point on the balance. Anyone who follows that will experience a far better journey and will smooth-out returns while always knowing what their own expectations are and will learn by experience to keep them realistic. And a second tip: know thyself and understand that the accumulation of wealth is not the end goal; it's the accumulation of wisdom and arriving (early) at contentment. Good luck.


Leave a Comment:

RELATED ARTICLES

4 ASX small caps poised for a big year

Four all-time best charts for every adviser and investor

Three all-time best tables for every adviser and investor

banner

Most viewed in recent weeks

Australia's retirement system works brilliantly for some - but not all

The superannuation system has succeeded brilliantly at what it was designed to do: accumulate wealth during working lives. The next challenge is meeting members’ diverse needs in retirement. 

Australian stocks will crush housing over the next decade, 2025 edition

Two years ago, I wrote an article suggesting that the odds favoured ASX shares easily outperforming residential property over the next decade. Here’s an update on where things stand today.

The 3 biggest residential property myths

I am a professional real estate investor who hears a lot of opinions rather than facts from so-called experts on the topic of property. Here are the largest myths when it comes to Australia’s biggest asset class.

AFIC on the speculative ASX boom, opportunities, and LIC discounts

In an interview with Firstlinks, CEO Mark Freeman discusses how speculative ASX stocks have crushed blue chips this year, companies he likes now, and why he’s confident AFIC’s NTA discount will close.

Get set for a bumpy 2026

At this time last year, I forecast that 2025 would likely be a positive year given strong economic prospects and disinflation. The outlook for this year is less clear cut and here is what investors should do.

Where to hide in the ‘everything bubble’

It might not be quite an ‘everything bubble’ but there’s froth in many assets, not just US stocks, right now. It might be time to stress test your portfolio and consider assets that could offer you shelter if trouble is coming.

Latest Updates

Economy

Get set for a bumpy 2026

At this time last year, I forecast that 2025 would likely be a positive year given strong economic prospects and disinflation. The outlook for this year is less clear cut and here is what investors should do.

Investment strategies

History says US market outperformance versus Australia will turn

Much has been made of how US markets, especially the NASDAQ, have significantly outperformed the ASX over the past two decades. History suggests the pendulum will swing back once again in Australia's favour.

Investment strategies

Announcing the X-Factor for 2025

What is the X-Factor - the largely unexpected influence that wasn’t thought about when the year began but came from left field to have powerful effects on investment returns - for 2025? It's time to select the winner.

Economy

The illusion of progress

What is progress? Is it GDP growth? Increasing wealth? New and improving technology? This argues that our measure of progress has become warped, and we're heading backwards rather than forwards.

Strategy

Our favourite summer reads

Summer is a great time to catch up on a good book. Here is a list of books on leadership, investing, and well-being for those looking to learn, reflect, and gain inspiration over the holiday season.

Sponsors

Alliances

© 2026 Morningstar, Inc. All rights reserved.

Disclaimer
The data, research and opinions provided here are for information purposes; are not an offer to buy or sell a security; and are not warranted to be correct, complete or accurate. Morningstar, its affiliates, and third-party content providers are not responsible for any investment decisions, damages or losses resulting from, or related to, the data and analyses or their use. To the extent any content is general advice, it has been prepared for clients of Morningstar Australasia Pty Ltd (ABN: 95 090 665 544, AFSL: 240892), without reference to your financial objectives, situation or needs. For more information refer to our Financial Services Guide. You should consider the advice in light of these matters and if applicable, the relevant Product Disclosure Statement before making any decision to invest. Past performance does not necessarily indicate a financial product’s future performance. To obtain advice tailored to your situation, contact a professional financial adviser. Articles are current as at date of publication.
This website contains information and opinions provided by third parties. Inclusion of this information does not necessarily represent Morningstar’s positions, strategies or opinions and should not be considered an endorsement by Morningstar.