Register For Our Mailing List

Register to receive our free weekly newsletter including editorials.

Home / 265

The SMSF gaps in the Productivity Commission’s Superannuation Report

The Productivity Commission’s 571-page ‘Report into Superannuation’ provides some well-researched findings on institutional funds, but it fails to hit the mark on SMSF performance. This is not a reflection on the quality of the Commission’s work, but it is a stark reminder of the inherent differences between how the Australian Prudential Regulation Authority (APRA) and the Australian Tax Office (ATO) report fund performance. We need to highlight and fill in some critical 'SMSF gaps' identified in the Commission’s draft Report.

The disparities in performance reporting result from:

  • The ATO includes contributions tax and insurance costs in net earnings while APRA does not.
  • Given these extra costs, the ATO performance measure will always be worse than APRA’s.
  • The smaller the SMSF balance, the higher the impact of those extra costs.

We have analysed publicly-available contribution tax and insurance data from the ATO to restate SMSF performance so it can be directly compared to institutional fund returns.

For the 10-year period the Commission’s Report covers, SMSFs outperformed APRA funds on a like-for-like basis.

  • In a technical supplement to the Report, the Commission noted that if APRA fund performance is calculated using the ATO method, then SMSFs outperform institutional funds (SMSFs 5.59% compared to 4.98%)
  • The Class submission shows that when SMSF performance is restated using the APRA approach, the amount by which SMSFs outperform institutional funds is even higher (SMSFs 6.71% compared to 5.58%).

The discrepancy around 10-year performance reporting

The Report highlights how institutional funds of different sizes performed over the 10 years from 2006 to 2015. In parallel, the Report should also show how SMSFs starting with different balances (e.g. $1,000 - $50,000 and $51,000 - $100,000) performed over the same period. Instead, they provide a mash-up of one-year performances across the 10 years.

The Commission noted in the Report:

“It is unclear to what extent the presence of small SMSFs in the system is necessarily a problem. It may be that many of these SMSFs will move into higher balance categories over time (or as the upfront capital costs are paid off), although this is difficult to discern given the lack of publicly-available panel data.”

This is highly concerning, given that super is all about saving over the long term, and the industry should be able to compare data on a like-for-like basis.

Class analysis of SMSF performance across five years shows that although funds with smaller balances do generate lower returns, the variance is considerably less than the exaggerated results provided in the draft Report.

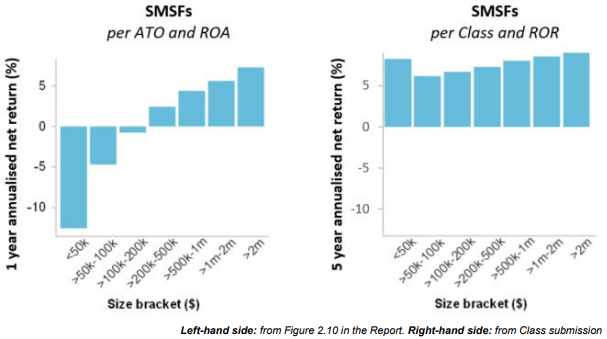
The analysis in the right-hand chart used APRA’s rate of return (ROR) method (as against the ATO’s return on assets (ROA) method) and looked at SMSF performance over the five years from 2013 to 2017. Funds were grouped by their starting balance in 2013.

Long-term fund analysis published by the ATO in the infographic SMSFs first lodged in 2012 FY: where are they five years on? did not include performance data. The ATO should provide a 10-year version of this document and it should include performance for all SMSFs, grouped by their start of year balance in 2006.

A call for collaboration between APRA and the ATO

It appears that the advice the Commission received from the regulators was that it is ‘too hard’ to compare the performance of APRA funds against SMSFs. This is disappointing, given the dual regulators are responsible for an industry worth over $2.5 trillion. The competing approaches deliver significant performance reporting differences.

It’s time that the two industry regulators collaborated to deliver accurate insights into like-for-like fund performance.

A full copy of the Class submission can be downloaded here.


Kevin Bungard is CEO of Class Limited, a provider of SMSF administration software.


  •   2 August 2018
  • 6
  •      
  •   
6 Comments
Cam
August 01, 2018

Great article. A number of organisations, etc at the industry/retail fund level have used the PC report to push for a $1m minimum SMSF balance. The various SMSF bodies should use the facts per this article to promote SMSFs as outperforming larger funds. A media campaign would be great. Also communicating this to Kelly O'Dwyer, and Labor's equivalent.

Fundie
August 02, 2018

No wonder everyone complains about data quality. Those return numbers look very low – 4% and 5% returns for 10 years ?!?!? With returns like that - why bother? (institutional super or SMSFs alike) – they are medians of course – but they are woeful.

SMSF Trustee
August 03, 2018

Fundie, over the last 10 years the share market delivered only about 7-8% per annum, so 4-5% for the average of funds that include conservatively invested funds is about right. Certainly far from being 'woeful'!

Mate, it's what the market has delivered. Some 'fundies' seem to believe they can conjure returns that aren't really there and prove their genius, but I don't believe them. 95% or so of the returns I'm looking for in my funds are from the market, not from the genius factor (aka 'alpha').

And as someone else said in a comment on your rant, once the GFC years drop out, the 10 year numbers will improve. Balanced fund trailing average returns will rise to around 8-9% pa.

Alfred Ellis
August 02, 2018

The very high costs charged by Industry and Commercial Funds which lead to SMSFs being established. NOW, the ever increasing costs incurred by SMSFs since the Federal Governments collaborated with their Labor cohorts and introduced changes in 2016. Labor again responding to their UNION MASTERS constant attacks, dictated by their 'self interest' which is to lessen the attractiveness of their main competitors, the SMSFs. This means members of all funds are being sucked dry by all and sundry. The Super System is of not much advantage to those that will end up with an Aged Pension and for those saving to pay themselves a pension they will find themselves 'no better off' than those who have not scrimped and saved, but enjoy their lives with many holidays and not worry about tomorrow! It is just not worth the bother! Pedro the Swift. .

b0b555
August 02, 2018

@ Fundie, give it another year or so and watch the 10 year returns "magically" look wonderful. I wonder what could have happened around 10 years ago that will soon drop off this calculations.

Robert Hutchings
August 05, 2018

I found this article very enlightening. The CLASS submission is an excellent explanation on the evaluation on S/F performance. I have been tracking the return of our own SMSF against industry find performance (as reported by the Annual Rating reports published in the media) and have long wondered how those funds make allowance for mergers, excess of withdrawals over contributions etc. I am a little suspicious of claims made as there appear to be discrepancies which could be due how these other factors are considered. For example: The recent performance table indicate a top fund having 1,5 and 10 year performances of 12.5, 11.0 and 7.4% respectively (which hopefully are CAGR figures), whilst the same fund was reported the previous year as having performances (over 1,5 and 10 years) of 13.2, 11.8 and 5.8 % respectively . ! cannot reconcile the difference in the 10 year CAGR's with the changes which have simply occured in the latest year included, or the year dropped off.


Leave a Comment:

RELATED ARTICLES

Meg on SMSFs: Ageing and its financial challenges

Are SMSFs getting too much of a free ride?

How to prevent excessive superannuation balances

banner

Most viewed in recent weeks

Retirement income expectations hit new highs

Younger Australians think they’ll need $100k a year in retirement - nearly double what current retirees spend. Expectations are rising fast, but are they realistic or just another case of lifestyle inflation?

Four best-ever charts for every adviser and investor

In any year since 1875, if you'd invested in the ASX, turned away and come back eight years later, your average return would be 120% with no negative periods. It's just one of the must-have stats that all investors should know.

Why super returns may be heading lower

Five mega trends point to risks of a more inflation prone and lower growth environment. This, along with rich market valuations, should constrain medium term superannuation returns to around 5% per annum.

Preparing for aged care

Whether for yourself or a family member, it’s never too early to start thinking about aged care. This looks at the best ways to plan ahead, as well as the changes coming to aged care from November 1 this year.

Our experts on Jim Chalmers' super tax backdown

Labor has caved to pressure on key parts of the Division 296 tax, though also added some important nuances. Here are six experts’ views on the changes and what they mean for you.        

Why I dislike dividend stocks

If you need income then buying dividend stocks makes perfect sense. But if you don’t then it makes little sense because it’s likely to limit building real wealth. Here’s what you should do instead.

Latest Updates

A speech from the Prime Minister on fixing housing

“Fellow Australians, I want to address our most pressing national issue: housing. For too long, governments have tiptoed around problems from escalating prices, but for the sake of our younger generations, that stops today.”        

Taxation

Family trusts: Are they still worth it?

Family trusts remain a core structure for wealth management, but rising ATO scrutiny and complex compliance raise questions about their ongoing value. Are the benefits still worth the administrative burden?

Exchange traded products

Multiple ways to win

Both active and passive investing can work, but active investment doesn’t in the way it is practised by many fund managers and passive investing doesn’t work in the way most end investors practise it. Here’s a better way.

Economy

The Future Fund may become a 'bad bank' for problem home loans

The Future Fund says it will not be paying defined benefit pensions until at least 2033 - raising as many questions as answers. This points to an increasingly uncertain future for Australia's sovereign wealth fund.

Investment strategies

Managed accounts and the future of portfolio construction

With $233 billion under management, managed accounts are evolving into diversified, transparent, and liquid investment frameworks. The rise of ETFs and private markets marks a shift in portfolio design and discipline. 

Property

Commercial property prospects are looking up

Commercial property is seeing the same supply issues as the residential market. Given the chronic undersupply and a recent pickup in demand, it bodes well for an upturn in commercial real estate prices.

Infrastructure

Private toll roads need a shake-up

Privatised toll roads in Australia help governments avoid upfront costs but often push financial risks onto taxpayers while creating monopolies and unfair toll burdens for commuters and businesses.

Sponsors

Alliances

© 2025 Morningstar, Inc. All rights reserved.

Disclaimer
The data, research and opinions provided here are for information purposes; are not an offer to buy or sell a security; and are not warranted to be correct, complete or accurate. Morningstar, its affiliates, and third-party content providers are not responsible for any investment decisions, damages or losses resulting from, or related to, the data and analyses or their use. To the extent any content is general advice, it has been prepared for clients of Morningstar Australasia Pty Ltd (ABN: 95 090 665 544, AFSL: 240892), without reference to your financial objectives, situation or needs. For more information refer to our Financial Services Guide. You should consider the advice in light of these matters and if applicable, the relevant Product Disclosure Statement before making any decision to invest. Past performance does not necessarily indicate a financial product’s future performance. To obtain advice tailored to your situation, contact a professional financial adviser. Articles are current as at date of publication.
This website contains information and opinions provided by third parties. Inclusion of this information does not necessarily represent Morningstar’s positions, strategies or opinions and should not be considered an endorsement by Morningstar.