Global financial markets have been volatile in recent times, for a whole range of reasons.
They include the overhangs of high inflation and interest rates around the world and their flow-on impacts to different economies. Then there’s the ongoing geopolitical tensions occurring in different parts of the world, primarily in Europe, Asia, and Africa, but also in the United States.
There’s no denying that volatility can be hard for investors to stomach. It’s tempting to seek shelter and turn to cash with some or all of your nest egg. When the clouds clear you’ll know when to get back in, right?
Well, we’ve looked at the data and unfortunately, most of us that try to time the market get it wrong. History shows us that investing broadly across equities markets has been a prudent long-term strategy for many. It’s discipline that seems matter most during thevolatilityse periods of market unrest.
With that in mind, here are five reasons why investors should persevere during periods of volatility.
1. Market corrections, including bear markets, are a part of investing life.
Bear markets and corrections are a part of life for investors, who are best served by maintaining a long-term focus. The share market has delivered long-term average rates of return between 7-10% over long periods of time. But those returns only measure what buy and hold investors would earn by putting money in and keeping their money invested through good times and bad.
Since 1980, there have been 12 bear markets in global equities. While the current United States bear market, which began in January 2022, continues, the past shows that equities typically recover and post strong results over the long term.
It’s worth noting that while the downturn that began in March 2020 at the start of the COVID-19 pandemic doesn’t meet our definition of a bear market because it lasted less than two months, we are counting them as bear markets and including them in our analysis because of their historic nature and the magnitudes of their declines.
Since 1980 there have been 12 bear markets
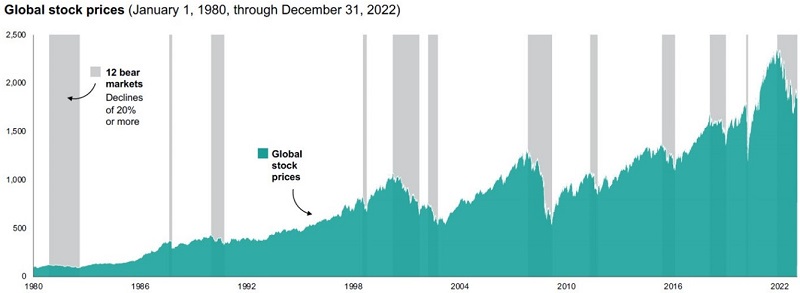
Note: Although the downturns that began in August 1987 (related to Black Monday) and February 2020 (related to the start of the COVID-19 pandemic) don’t meet a widely accepted definition of a bear market because they lasted less than two months, we are counting them as bear markets and including them in our analysis because of their historic nature.
Sources: Vanguard calculations, as of 31 December 2022. MSCI World Index from 1 January 1980, through 31 December 1987, and the MSCI ACWI thereafter.
2. Dramatic market losses can sting. Recoveries typically follow.
While bear markets can be daunting, on average they have lasted much shorter than bull markets and have had far less of an effect on long-term performance.
From 1 January 1980 through 31 December 2022, the average length of a bull market has been nearly four times that of a bear market. Similarly, the depth of losses from a bear market has paled in comparison with the magnitude of bull-market gains. That’s one reason for sticking to a well-thought-out investment plan: Losses from a bear market have typically given way to longer and stronger gains.
Bear markets are challenging, but bull markets are longer and stronger
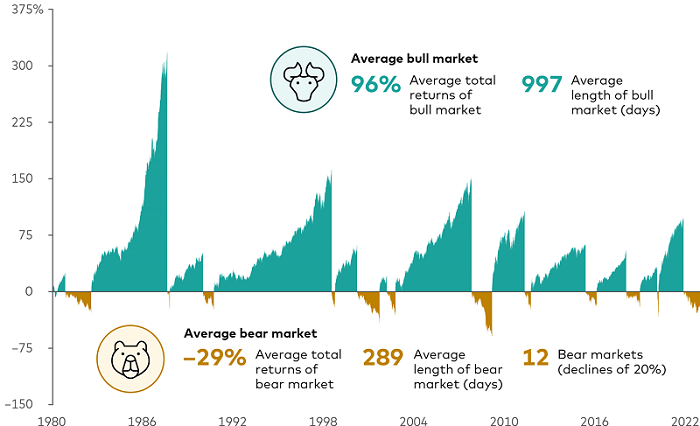
Note: Although the downturns that began in August 1987 (related to Black Monday) and February 2020 (related to the start of the COVID-19 pandemic) don’t meet a widely accepted definition of a bear market because they lasted less than two months, we are counting them as bear markets and including them in our analysis because of their historic nature.
Sources: Vanguard calculations, as of 31 December 2022, using the MSCI World Index from 1 January 1980 through 31 December 1987, and the MSCI ACWI thereafter. Indexed to 100 as of 31 December 1979.
3. Timing the market is futile. The best and worst trading days often happen close together.
One reason investors shouldn’t try to time the market is they run the risk of missing out on strong performance, which can seriously hamper long-term investment success.
Historically, the best and worst trading days have tended to cluster in brief time periods, often during periods of heightened market uncertainty and distress, making the prospect of successful market-timing improbable.
As this chart shows, the best and worst trading days often occur within days of each other. Ten of the 20 best trading days, as measured by the MSCI World Price Index, from 1 January 1980 through 31 December 2022, occurred during years of negative total returns.
Meanwhile, 11 of the 20 worst trading days occurred in years with positive total returns—another sign of the futility of timing the market.
So practically speaking, when it comes to the market timing game, while there are a handful of experts that can do it repeatedly, for most of us it’s an unrewarding experience and the only winning move is not to play.
Timing the market is futile. The best and worst trading days happen close together
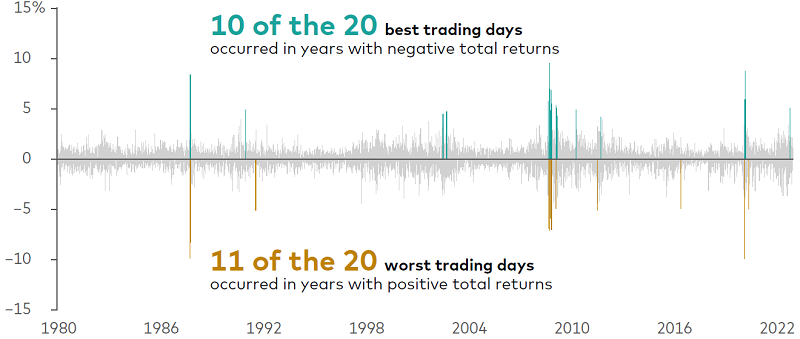
Sources: Vanguard calculations as of 31 December 2022, based on data from Refinitiv using the MSCI World Price Index. Past performance is no guarantee of future returns. The performance of an index is not an exact representation of any particular investment, as you cannot invest directly in an index.
4. Don’t panic during market turmoil.
Those who have overreacted to market events by moving to cash have typically seen their portfolios underperform the markets. Long periods out of the market make matters worse and can be one of the most serious mistakes individual investors make.
Fast, significant market downturns are infrequent. When they do occur, investors may be so frightened that they move their portfolio to cash—an event made doubly challenging because investors also have to pick the right time to get back into the market. We looked at monthly stock market returns from 1 January 1980 through 31 December 2022, and found that a three-month decline of 10% or more occurred in equity markets only 6% of the time.
Because periods of such severe market stress occur so infrequently, it is easy to forget and overreact to the bad news. For example, we found that investors have a 74% probability of underperforming the market with an average underperformance of 4.1% when they have moved their balanced 60% stock/40% bond portfolios into all-cash portfolios for three months after a severe market event.
Portfolio underperformance gets even worse for those who convert their balanced portfolios to cash and hold it for longer periods of time. Converting a 60/40 portfolio to cash has led to a 71% probability of underperformance over a six-month period with an average underperformance of 7.4%. And when investors have converted their 60/40 portfolio to cash and held it for 12 months, they have an 87% probability of underperforming with an average underperformance of 13.5%.
Moving to cash in a panic rarely pays off
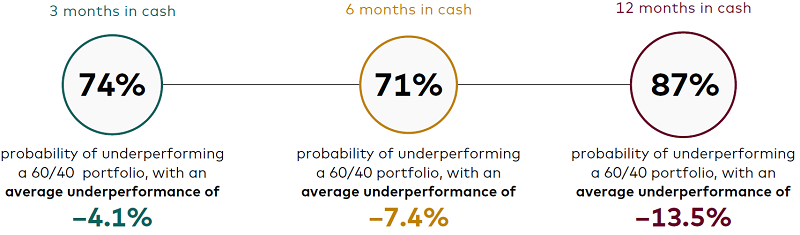
Notes: Equities in the 60% equity/40% fixed income portfolio are represented by the Russell 3000 Index, and fixed income is represented by the Bloomberg U.S. Aggregate Bond Index. Cash is represented by the FTSE 3-Month Treasury Bill Index. Monthly data are from January 1980 through December 2022. Equity losses of more than 10% over three months trigger the move from a 60/40 portfolio to all cash in the illustration.
Source: Vanguard total return calculations, as of 31 December 2022.
5. Balanced portfolios of stocks and bonds have proven resilient.
The longer you hold a balanced portfolio, the more likely you are to experience positive performance.
Over a 10-year holding period, a portfolio of 60% stocks and 40% bonds hasn’t had a negative nominal return (not accounting for inflation) and has had significantly less likelihood for negative real returns (accounting for inflation) compared with shorter holding periods.
One way to look at the long-term value of holding a balanced portfolio is to examine how quickly stocks and bonds recover from periods of poor performance. Using the MSCI All-Country World Index and the Bloomberg Global Aggregate Total Return Bond Index as proxies for stocks and bonds and examining these indexes’ performance from January 1990 through December 2022, we found that balanced portfolios are quite resilient over longer time periods.
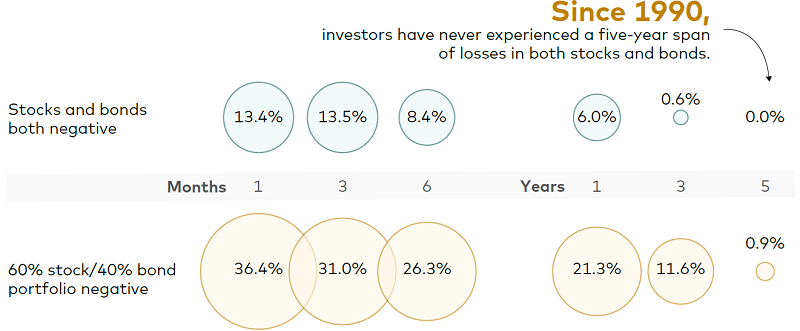
Historically, diversified portfolios have recovered within a few months
Notes: Data reflect rolling total returns for the periods shown and are based on underlying monthly total returns for the period from January 1990 through December 2022. The MSCI ACWI and the Bloomberg Global Aggregate Total Return Index Unhedged were used as proxies for stocks and bonds, respectively.
Source: Vanguard calculations, as of 31 December 2022.
Stocks and bonds have both experienced negative performance in the same month 13.4% of the time, over the same three-month period 13.5% of the time, and over the same six-month period 8.4% of the time. But these two asset classes have both experienced negative total returns only 6% of the time over one-year periods.
And since 1990, investors have experienced negative returns in both asset classes only 0.6% of the time over the same three-year period and have never experienced negative returns in both asset classes over a five-year period.
A similar pattern exists with a 60% stock/40% bond portfolio. A 60/40 portfolio produced negative returns in the same month 36.4% of the time. Over three- and six month intervals, this portfolio produced negative returns 31% and 26.3% of the time.
But over longer periods of time, a portfolio composed of 60% stocks and 40% bonds has proven more resilient.
Over one-year periods, it has produced negative returns 21.3% of the time. Over three- and five-year periods, it has produced negative returns just 11.6% and 0.9% of the time, respectively.
Conclusion
Most of the financial headlines we read are rightly focused on the events of the day. But when it comes to your investment portfolio, today is not that important in the context of a 20-to-40-year investment horizon. Over your lifetime, it is the asset allocation you make and stick with that will drive your investment success.
Rather, investors should focus on the things they can control, such as having clear, appropriate investment goals; developing a suitable asset allocation using broadly diversified funds; minimising investment costs; and maintaining perspective and long-term discipline. After all, you can afford not be the best investor in the world, but none of us can afford to be a bad one.
Duncan Burns is Chief Investment Officer for Asia-Pacific at Vanguard Australia, a sponsor of Firstlinks. This article is for general information purposes only and does not consider the circumstances of any individual.
For more articles and papers from Vanguard Investments Australia, please click here.