Register For Our Mailing List

Register to receive our free weekly newsletter including editorials.

Home / 666

Income tax and bracket creep

As the budget fallout continues, Jim Chalmers gave the following reply to a post-budget question asking if the top marginal tax rate comes in at a salary that is too low:

“First of all, we have increased the top threshold in the tax system, we did that a couple of budgets ago. Secondly, we do understand how important it is that bracket creep be returned, and that’s why we’ve done it 5 times in 3 different ways. We’ve increased the threshold, we’ve cut the rates, we’ve provided tax relief via a standard deduction, and now we’re providing tax relief via a Working Australian Tax Offset.”

The “five” tax cuts he was referring to were:

1. The Labor redesigned Stage 3 tax cuts from July 2024

  • Included rate cuts and threshold changes.
  • This was a modified Coalition Stage 3 tax cuts package. Changes:
    - proposed 30%: $45,000 to $200,000
    - became 30%: $45,000 to $135,000 and 37%: $135,000 to $190,000.
    - lowest marginal rate cut from 19% to 16%.
  • The “we have increased the top threshold”, which was from $180,000 to $190,000, was actually a decrease from the proposed Coalition $200,000.

2. A cut from July 2026

  • 16% marginal rate to 15%. A maximum tax cut of $268 per annum.
  • Announced in the 2025-26 budget.

3. A further cut from July 2027

  • 15% marginal rate to 14%. A maximum tax cut of $268 per annum.
  • Announced in the 2025-26 budget.

4. The $250 Working Australians Tax Offset (WATO)

  • Begins 2027–28.
  • Announced in the 2026-27 budget.
  • A fixed offset, it is worth more to lower earners and its value erodes over time.

5. A $1,000 instant deduction for work-related expenses (announced in the 2026-27 Budget)

  • Up from $300.
  • Chalmers explicitly included this as an income tax cut mechanism.
  • A bit of a stretch counting this as a tax cut when it is really a simplification or admin measure which may benefit some taxpayers but not all.

Including all announced Labor changes up to 2027-28, the following table compares average tax rates at selected salary levels, with what they would have been under the Coalition’s Stage 3 changes.
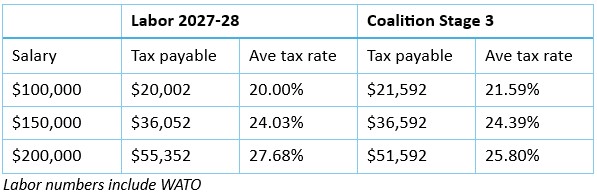
Note that under Labor, even after the “five” tax cuts, average tax rates are no better to worse than the Coalition for mid to high income earners. Lower income earners fare better with the Labor Stage 3 redesign which effectively redistributed high income tax cuts to lower incomes. Not forgetting that the Coalition had favoured lower incomes in its Stages 1 & 2 tax cuts, bringing the $100,000 average tax rate down from 24.50% to 22.97%.

The latest Labor tax cut in the form of the permanent $250 WATO goes some way towards winding back bracket creep since the Stage 3 tax cuts, but it is likely to be swamped by additional tax collected from nominal wage growth, even before it actually commences.

Bracket creep occurs when workers see an increase in their average tax rate because of nominal wage growth, regardless of real wage growth.

For example, consider a wage earner on $100,000. Current tax excluding the Medicare levy is $20,788, for an average tax rate of 20.79%. If their wages kept pace with inflation at say 3%, rising to $103,000, tax payable becomes $21,688, or 21.05%. The average rate has increased because a greater proportion of the earner’s salary is in the higher tax bracket.

Had the average tax rate not jumped, tax on the $103,000 would be $276 less, which is more than one year’s WATO. For a salary going from $200,000 to $206,000, the equivalent increase in tax burden would be $1,016, or more than four years’ WATO.

This prompts the question as to how effective tax relief in the form of offsets and irregular rate cuts compares to permanent protection against bracket creep, as proposed by the Coalition in its budget reply. It would do this by indexing tax brackets to the Consumer Price Index should it win government at the next election.

Continuing with the above example under an indexation model. The $18,200 tax free threshold would rise 3% to $18,746. The next threshold at $45,000 would increase to $46,350, and so on with the higher thresholds. Calculating tax payable according to the indexed thresholds:

16% x ($46,350 - $18,746) + 30% x ($103,000 - $46,350) = $21,412
(an average rate of 20.79% and unchanged from the average when salary was $100,000 a year prior)

That is, a system that indexes tax brackets protects workers from increased tax on nominal wage growth due to inflation.

This example also highlights the fact that bracket creep is broader than simply moving into a higher tax bracket because of increasing wages, which might be referred to as ‘inter-bracket creep’. Because it also includes the increase in tax burden when the taxpayer moves deeper into the same marginal tax bracket, or ‘intra-bracket creep’. The taxpayer is ‘creeping’ through the bracket.

Features that emerge from a tax schedule indexed to inflation include:

  • If wage growth = threshold indexation rate, there is no bracket creep as average tax rates remain the same. You would always remain in the same marginal tax bracket.
  • If wage growth > threshold indexation rate, there is real wage growth, average tax rates rise, and movement into a higher tax bracket is possible.
  • If wage growth < threshold indexation rate, real wages retreat, average tax rates decline, and movement into a lower a tax bracket is possible. Could we call this ‘bracket retreat’?

Therefore even with an indexed tax scale system, progressivity remains if real wage growth is positive. And under a Coalition model, bracket creep would reflect real wage growth, not nominal wage growth. That would be ‘real tax creep’.

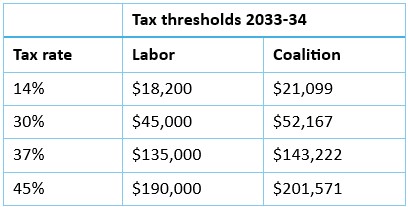
The Coalition indexation policy more specifically, would begin indexing the two lowest tax brackets to inflation from 2028-29, and the top two brackets from 2031-32. It would be instructive then to consider what happens over time with and without indexation, to thresholds and average tax rates.

We first compare what the Coalition’s indexed thresholds in 2033-34 would be, five years after the commencement of indexation, with Labor’s 2027-28 thresholds which are assumed to remain unchanged. Assuming indexation at an inflation rate of 3% p.a. would yield:
Now consider the same three salaries from Table 1, assuming 3% p.a. salary increases in the five years to 2033-34. Tax payable and average tax rates under Labor and the Coalition in 2033-34 would be:
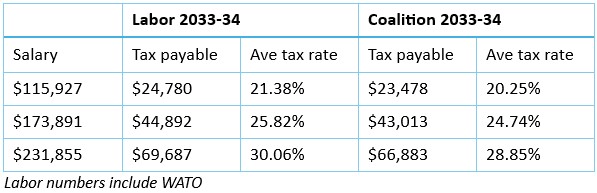
This exercise isolates the effect of bracket creep driven by inflation. It shows that while Labor average tax rates rise from their 2027-28 levels in Table 1, Coalition average tax rates remain broadly stable. In fact, with wage growth in line with inflation, Coalition rates would be equal to the Labor average tax rates in Table 1 if Labor’s rates didn’t include WATO, and if the introduction of the Coalition policy wasn’t staggered.

If WATO remains fixed at $250, it will offset a fraction of the increased tax burden arising from bracket creep.

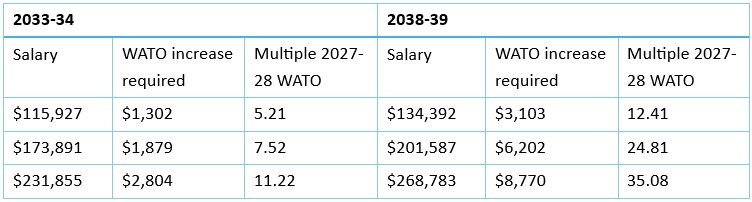
By 2033-34, WATO[1] would need to increase by $1,302, $1,879, and $2,804 respectively for the three salaries (being the difference between Labor and Coalition tax payable in Table 3), to reduce Labor average rates to the Coalition levels.

And extending the exercise under the same assumptions for a further five years to 2038-39, the WATO[1] increase required to match Coalition policy would be $3,103, $6,202, and $8,770 respectively for the three salaries analysed. These amounts represent many multiples of the current $250 on offer.

Granted that while in office, Labor may return some bracket creep with more tax cuts or by increasing WATO, this analysis demonstrates that the effects of bracket creep can be profound.

Meanwhile the discussion should focus less on the number and format of “tax cuts” made to date, and more on whether taxpayers are being adequately compensated for bracket creep over time.

1 Increase in WATO required to neutralise inflation-induced bracket creep based on Labor 2027-28 tax settings.
Tony Dillon is a freelance writer and former actuary. This article is general information and does not consider the circumstances of any investor.


  •   10 June 2026
  • 11
  •      
  •   
11 Comments
AndyB
June 11, 2026

Chalmers and Albo have implemented bracket creep on steroids with the 30% minimum tax on capital gains. Applying such a punitive rate when an Individual would pay zero or a low rate according to the tax scales for any other type of income from word, bank interest, share dividends etc is just Labor dogma to punish the perceived rich.
This punitive tax will not assist any younger people to buy a house - quite the reverse.

13
David
June 11, 2026

The current tax thresholds were set in 2012. Since then we have had around 50% accumulated inflation. There has to be a considerable catch up to resurrect fairness. Just to start to index a 2012 set of numbers from now on is nowhere near good enough. Including the tax free threshold, we have 5 tax rates in the system. We have just had an adjustment to the minimum wage for the lowest legally paid workers in the land. If they work a full time job at this pay, all the increase is taxed at the middle rate of 30%, their marginal rate. I personally believe that if you only earn the lowest pay of all, you should not be taxed at all. That's where the tax free threshold should begin. The government won't collect enough tax without them, I hear you say. My answer is the government should trim its spending to suit.

9
Nadal
June 11, 2026

The WATO is only received by those in receipt of salary / wages. Self-funded retirees still exposed to bracket creep under the current govt's approach to taxation reform.

7
David Richardson
June 11, 2026

I have been disappointed that governments havent chosen to give tax cuts - this was the best way to allow people to navigate cost of living increases and their day to day budgets. To my mind its also the best way to reward people who are working. Governments have proven that they are terrible at running their projects - paying consultants and overseas companies top dollar for work of questionable quality, a ineffective and bloated and self serving public service, cost over runs, rorts, theft. Let people decide how to spend their own money.

7
CC
June 11, 2026

What did you expect ?
Labor is always about tax, tax and more tax.
Too bad that those evil "rich" so and so's earning the insanely high ( not ! ) 200K incomes can barely afford a mortgage

4
Dudley
June 12, 2026


"200K incomes can barely afford a mortgage":

They don't need a mort-gage.
If Bank of Dad and Mum is a no-go, they could rent and buy a home cash on the knocker in 4 years by SAVING.

6
Peter S
June 11, 2026

I don't see any valid comparison between potential Coalition tax rates in 33/34 with Labor rates in 27/28. It's like comparing fiction with reality. And you have to assume the Coalition wouldn't break their promise, a la Tony Abbott. It's a big ask Tony Dillon.

4
Albert
June 11, 2026

The Australia Institute has produced a short paper that shows that, relative to tax indexation, taxpayers have benefited from ad hoc discretionary changes in the tax scales under various governments over the last 30 years. This challenges the central claim for indexation of tax thresholds - that Governments have been "stealing" from taxpayers.

Link below.

https://australiainstitute.org.au/wp-content/uploads/2026/06/P2023-How-would-tax-indexation-have-affected-Australian-taxpayers.pdf

1
Alan
June 13, 2026

Whether these combined ad hoc cuts approximate a similar result or not, leaving it to the discretion of the government of the day encourages misuse for politically driven motives and lacks objectivity.

If indeed the overall result is broadly similar, there is no reason not to bring some integrity to the process and remove it from the hands of politicians with their various agendas.

2
Tony Dillon
June 13, 2026

Hi Albert,

I had a quick look at that paper and found that it was misleading, to say the least.

It concludes that tax payers have benefited form ad-hoc changes to tax scales since 1996 and therefore there has been no “fiscal drag” or bracket creep since then because had there been indexation of tax scales, taxpayers would be worse off.

The first problem is their analysis is not comparing like with like. If you are going to test for bracket creep, you vary tax thresholds via indexation while holding everything else constant. In particular, you hold real wage income and marginal rates constant. So you compare same real income, same tax rates, different thresholds. But they mixed inflation, real wage growth, tax rate reform, and threshold indexation. Which is very distorting when wages have basically tripled since 1996, while CPI doubled. And there have been marginal rate changes.

They should have compared AWE x 2/3 (reverse the tripling of wages since ’96 and double to compare the same relative income) on indexed ’96 thresholds but with 2026 marginal rates, if they were isolating inflation-driven bracket creep only. Instead they compared full AWE that had tripled since ’96, on indexed thresholds that had doubled, with ’96 marginal rates. They conflated variables in their analysis when they shouldn’t have.

Had they kept relative income and tax rates the same, their claim that taxpayers on AWE are better off by $7.6k under the 2026 schedule would drop to about $1.3k. So almost no change.

So their analysis in using today’s income levels embedded real wage growth and turned the exercise into measuring a hybrid of bracket creep, real income progression, and tax reform, which is not a clean measure of indexation effects.

The second problem, is they conveniently selected 1996 as a base, just before sweeping changes were made to the tax schedule in 2001 to compensate for the introduction of the GST. Marginal rates fell significantly at that time. Then there was the tripling of the tax-free threshold from $6,000 to $18,200 in 2012 introduced by the Gillard government to offset the introduction of the carbon tax. Strip those measures out which are compensating income tax changes as opposed to discretionary, then the AWE differential quoted in their paper drops even more. Noting the $18,200 threshold is still the same today, perhaps the authors could re-do their analysis over the period since 2012.

9
 

Leave a Comment:

RELATED ARTICLES

3 ways to defuse intergenerational anger

The fetish for lower taxes has gone too far

Indexing tax thresholds to address bracket creep

banner

Most viewed in recent weeks

Are you making these SMSF mistakes?

After four decades advising investors, there are a few common mistakes I've seen SMSF investors make. From holding too much cash and chasing yield to overtrading and trusting tips. Are these errors costing you?

Why have Australian living standards 'fallen' and how do we fix it?

For the last few years there has been much talk of a 'cost-of-living' crisis in Australia and of 'falling living standards'. Lately this has flared up again with the pickup in inflation resulting in a renewed fall in real wages.

Will you run out of money in retirement?

Fear of running out has become a defining retirement anxiety. Why do some retirees die with substantial wealth while others deplete their nest egg? Evidence suggests the answer is more complicated than we think. 

Four options for an income investor’s next dollar

What if Australia’s golden age of dividends is ending? Rather than overhaul your portfolio, it may be worth considering where new capital can work harder. I discuss four income strategies and the trade-offs behind each.

Retirement spending is not one-size-fits-all

New data challenges the idea that Australians are underspending their super. The bigger issue may be helping retirees navigate complexity, make confident decisions and use their savings to support security, wellbeing and choice.

The missing link in the CGT debate

A little-noticed consequence of Labor’s tax changes could have implications well beyond investors’ tax bills. The issue raises bigger questions about incentives, capital allocation and the drivers of long-term economic growth.

Latest Updates

SMSF strategies

Meg on SMSFs: What do we think about reversionary pensions these days?

Reversionary pensions have long been a staple of SMSF estate planning, but are they still the best option? Meg Heffron revisits a once-clear favourite and asks whether changing super rules have shifted the balance.

The ageing ‘crisis’ has not and will not happen

Rising age dependency is frequently treated as a warning sign for economies. But when actual workforce participation is examined, a strikingly different picture emerges about ageing, productivity and economic sustainability.

Retirement

How does the 4% rule stack up?

The 4% rule has long been retirement's gold standard. But after a difficult period for investors, fresh analysis suggests a more conservative approach may significantly improve the chances of making savings last.

Shares

Four charts that expose market concentration risk

Investors have recently been rewarded for backing market leaders, but history suggests this eventually comes at a cost. Now may be the time to review whether your portfolio is carrying unintended risks beneath the surface.

Investment strategies

The case for gearing beyond property

Most Australians gear into property but ignore shares. That may be a mistake. Used carefully, geared equity strategies can enhance long-term returns, reduce cash tied up in growth assets and support retirement income goals.

Economy

Australia's $1 trillion debt pile

The headlines exclaiming that Australian government debt has hit A$1 trillion and US government debt has hit $40 trillion has turned heads, but how serious are they really? Will Australia's mix of debt create challenges?

Economy

Has 100 years of growth made us any happier?

For decades, GDP has been the benchmark for economic success, but has it made us materially happier? If happiness does not rise in lockstep with prosperity, are we overlooking what constitutes a successful society?

Sponsors

Alliances

  • ASA-Logo-RGB-ActiveGreen-web.png

© 2026 Morningstar, Inc. All rights reserved.

Disclaimer
The data, research and opinions provided here are for information purposes; are not an offer to buy or sell a security; and are not warranted to be correct, complete or accurate. Morningstar, its affiliates, and third-party content providers are not responsible for any investment decisions, damages or losses resulting from, or related to, the data and analyses or their use. To the extent any content is general advice, it has been prepared for clients of Morningstar Australasia Pty Ltd (ABN: 95 090 665 544, AFSL: 240892), without reference to your financial objectives, situation or needs. For more information refer to our Financial Services Guide. You should consider the advice in light of these matters and if applicable, the relevant Product Disclosure Statement before making any decision to invest. Past performance does not necessarily indicate a financial product’s future performance. To obtain advice tailored to your situation, contact a professional financial adviser. Articles are current as at date of publication.
This website contains information and opinions provided by third parties. Inclusion of this information does not necessarily represent Morningstar’s positions, strategies or opinions and should not be considered an endorsement by Morningstar.