This article is the second in a new mini-series, Eight Temptations of Market Lore, which explores popular investing rules of thumb and the pitfalls that can accompany them.
The first article asked whether a high CAPE means the market is expensive. This one asks what investors really want to know: does a high CAPE predict poor returns?
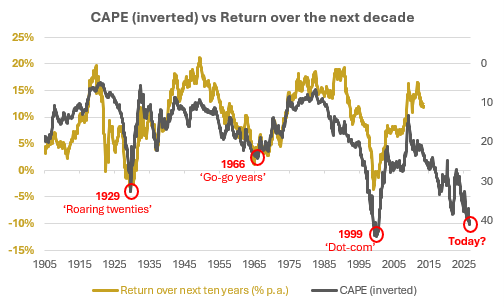
Over the past century, CAPE has forewarned poor returns. Each time CAPE peaked, in 1929, 1966 and 1999, a decade of returns well below the long-run average of about 9% a year followed. Today’s CAPE is approaching its 1999 dot-com peak. The chart below inverts CAPE and overlays the subsequent rolling ten-year return to highlight how they track each other closely for most of the century.
Source: Robert Shiller
The CAPE peaks are circled. The decades after 1929, 1966 and 1999 returned -3.4%, 3.9% and -0.7% a year. Looking back, the warnings seem obvious.
But the circles are drawn with hindsight. In December 1996, with CAPE at about 28 and closing in on its 1929 peak, Shiller told the Federal Reserve Board that the market was overvalued. Two days later, Alan Greenspan gave his “irrational exuberance” speech. The decade that followed included the dot-com crash, yet still returned 8.3% a year. That warning gets no circle.
Shiller’s warning came at 28, between the 1966 and 1929 peaks. Which peak should set the warning level? Suppose an investor had stayed out of shares whenever CAPE rose above its 1966 peak of 24. Between 1990 and mid-2023, they would have been out of the market 62% of the time. Those months still returned 9.8% a year. Using the 1929 peak of 33 kept investors out only 16% of the time. Nobody could have known in advance which one was right.
A regime shift
Neither peak worked because the relationship between CAPE and future returns structurally changed. From decades starting in the mid-1980s, CAPE began to understate the returns that followed. The dot-com bubble shows this clearly. In 1999, CAPE reached a record 44, about 35% above its 1929 peak and more than 80% above its 1966 peak. Based on the relationship before 1985, that should have ushered in a devastating decade, with losses of about 12.5% a year. The decade actually lost 0.7% a year. That was poor, but far milder than the reading implied.
CAPE went on understating future returns because new structural changes kept arriving, and few investors saw them coming. Interest rates fell for four decades, from about 16% on US 10-year bonds in 1981 to below 2% in the 2010s. Corporate tax cuts in 1986 and 2018 lifted after-tax profit margins. So did booking more profits in low-tax countries as companies expanded overseas. A 2023 Federal Reserve study by Michael Smolyansky found that lower interest and tax costs explain over 40% of the real growth in US corporate profits from 1989 to 2019. Stock buybacks took off after a 1982 SEC rule protected companies from manipulation charges, boosting earnings per share. And highly profitable technology companies, which have repeatedly reinvented their businesses, grew to a larger share of the index.
Recent years show how profit surges can blunt CAPE’s warning. At the end of 2019, CAPE was about 30, close to its 1929 peak. The 2020 COVID crash was met with enormous stimulus that sparked a strong recovery in corporate profits. CAPE climbed to about 39 by late 2021, on a wave of speculation that echoed the dot-com boom. It fell back in 2022 as inflation surged, interest rates rose sharply and big tech profits were downgraded. Then two things lifted profits again. First, most technology companies stopped chasing sales growth at any cost. They cut costs and used their pricing power to expand margins. For example, since late 2022, Amazon’s EBITDA margin has more than doubled, from about 11% to 24%. Because technology companies are a large part of the index, their margins lift the whole market. Second, the launch of ChatGPT in late 2022 set off a profit boom for chipmakers and cloud providers.
None of this was visible at the time. A regime shift only shows up once the decades behind it have finished. An investor in 1990 had only the old relationship to go on, with no way of knowing how profits would change. In two of the three decades since then, returns beat CAPE’s forecast by about 7 and 11 percentage points a year. And in recent years, each time CAPE looked expensive, a profit boom came to the rescue.
Conclusion
Today’s CAPE is high by any historical standard. Judged by the relationship before 1985, a CAPE reading of 41 points to a decade with losses of about 10% a year, worse than those experienced during the Great Depression. And judged by the relationship since the mid-1980s, it points to returns of about zero, similar to the decade after the dot-com peak.
Like the circled peaks, both relationships were only visible after the fact. An investor in 1999 or 2019 could see the reading, but not the decade that followed. Today’s investors are in the same position. If profits again grow faster than in the past, CAPE will overstate the damage to come. If they slow, the old relationship could return. We will only know which relationship holds in 2036.
So CAPE is better at telling you which way returns lean than how far. A high starting price has usually meant lower returns than a low one. What CAPE cannot tell you in real time is whether the old relationship still holds. For that, return to the question from the first article: is CAPE high because profits are, or because prices are?
Reference: Michael Smolyansky, “End of an Era: The Coming Long-Run Slowdown in Corporate Profit Growth and Stock Returns”, Federal Reserve Board, June 2023.
Jason Teh is a financial commentator and portfolio manager. This article is general in nature and does not constitute or convey personal financial advice. It has been prepared without consideration of anyone’s financial situation, needs, or financial objectives. Before acting on the areas discussed and contained herein, you should consider whether it is appropriate for you and whether you need to seek professional advice.