Register For Our Mailing List

Register to receive our free weekly newsletter including editorials.

Home / 588

90% of housing is unaffordable for average Australians

A new report by ANZ and CoreLogic paints a startling and depressing picture of housing affordability in Australia.

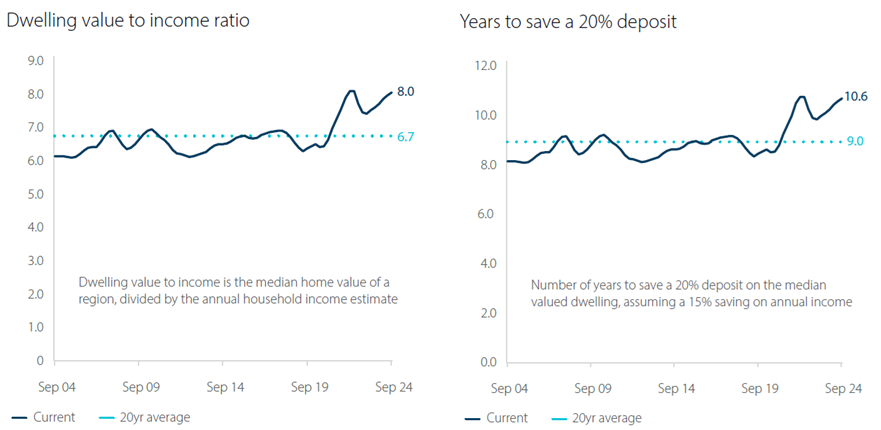
Over the 12 months to September 2024, our income growth has again significantly lagged housing and rental growth. Gross household income increased 2.8% to $101,000, trailing the 8.5% rise in the median dwelling value (houses, flats, and other residences) and the 9.6% lift in rents during the period. At the end of September this year, the median dwelling was worth $807,000 and the median weekly rent value was $642 across Australia.

Consequently, housing has become less affordable. The median dwelling value to income ratio has increased to 8x, almost 20% above the average of the past two decades. It’s now caught up to the record highs reached in early 2022.

Assuming an annual savings rate of 15% per annum, it now takes the average household 10.6 years to save a 20% deposit for an average dwelling.

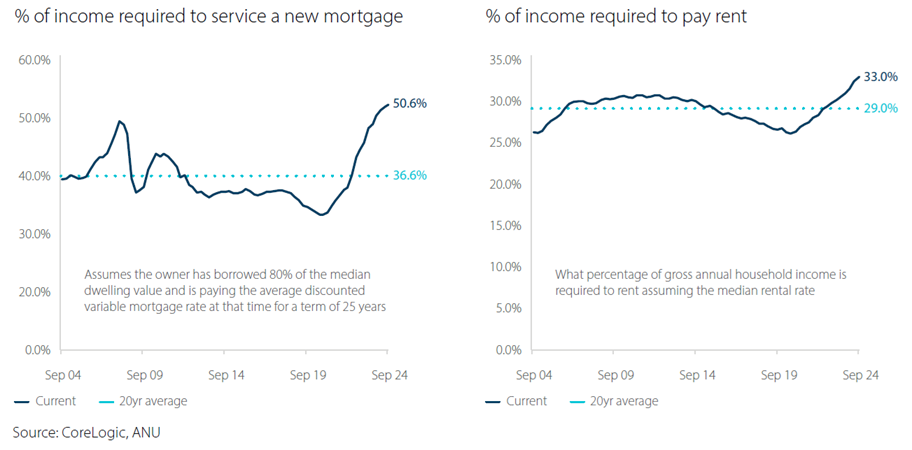
And assuming current mortgage rates for owner occupiers, a 20% deposit and a 25-year loan term, more than half of the median household income is needed to service a new home loan.

The report acknowledges that its focus on savings and income neglects other means of accessing the housing market such as selling a home already owned, using the Bank of Mum and Dad, access to Government schemes such as the First Home Guarantee, buying a cheaper home than your income would suggest you can, and so on.

However, it says that these alternative measures may be the reality for some, though not all. That’s why it’s important to assess housing values against incomes to benchmark housing affordability.

An extraordinary picture of housing affordability

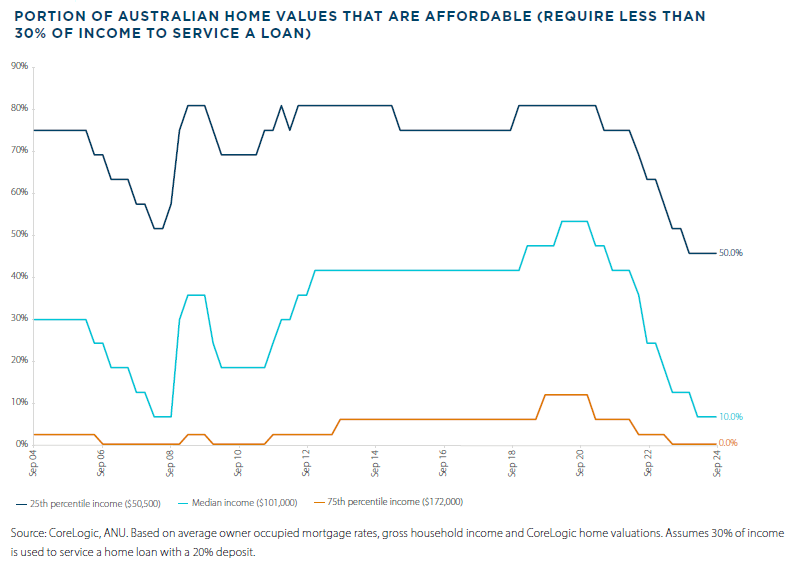
The report’s breakdown of housing affordability is eye-catching. It reveals only 10% of the housing market is genuinely affordable – require less than 30% of income to service a loan – for the median income household. That’s down from the 40% figure recorded just two-and-a-half years ago.

For low-income earners, the affordability figure drops to 0%. And even for the 75th percentile income household, with gross income of $172,00o per annum, only 50% can afford to service a current loan.

Are apartments set to outpace houses?

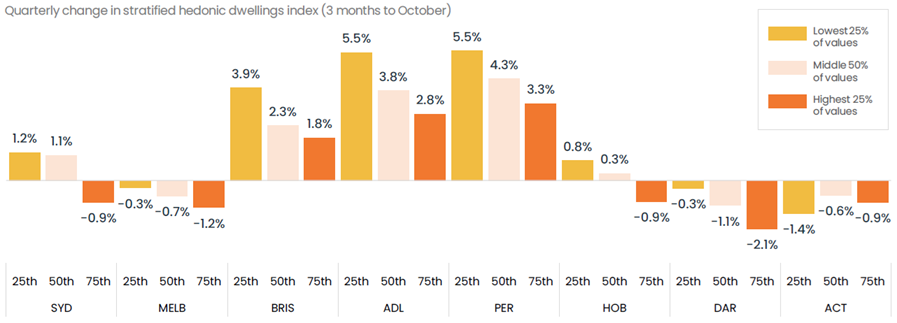
The authors note that less affordable housing may be shifting demand towards units over houses. In the three months to October, capital city unit prices rose 0.9% compared to the 0.8% increase in houses. A chart from another CoreLogic paper shows this trend most clearly.


Source: CoreLogic

The growth in unit versus housing values may not seem much yet they’re quite a turnaround from recent trends. Between March 2020 and October 2024, national housing values grew 44.5%, more than twice the rate of increase in units, at 20.7%.

Over the same period, the difference between the median house and unit value across Australia increased from $46,000 to $207,000. At September 2024, the portion of income needed to service a mortgage on a median value house was 55% versus the 42% for units.

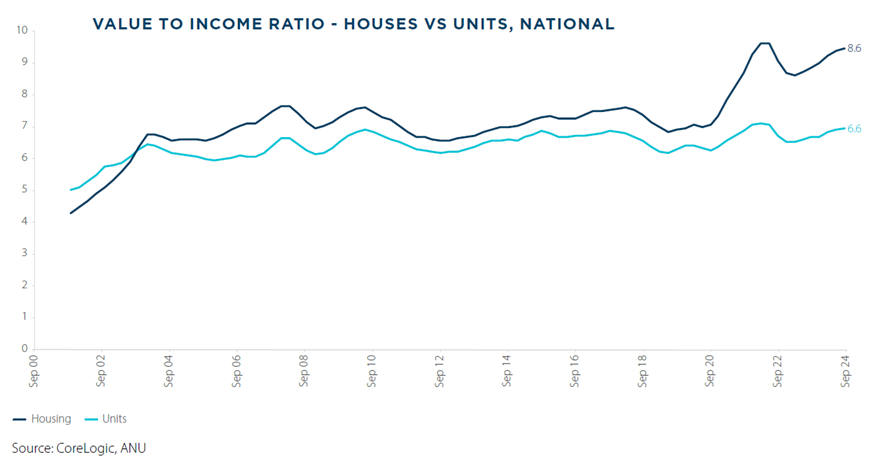
Moreover, the dwelling value to income ratio for houses has almost doubled to 8.6x over the past 23 years, while the same ratio for units has only increased 32% to 6.6x.

Comparing affordability across cities

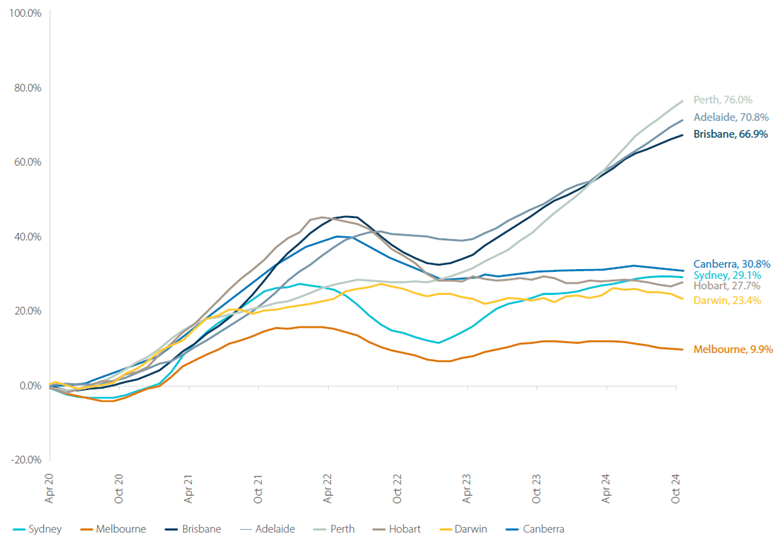
Affordability across the capital cities has changed dramatically since Covid. In the 4.5 years to October this year, the housing prices of three cities have rocketed, leaving the rest far behind. Perth, Adelaide, and Brisbane dwellings rose 76%, 71% and 67% respectively.

Meanwhile, the other cities haven’t done much, especially if you take inflation into consideration. Canberra, Sydney, Hobart and Darwin are up 23-31%, while Melbourne is only 10% higher (and down significantly in real terms).

Cumulative change in dwelling values since March 2020, capital city markets

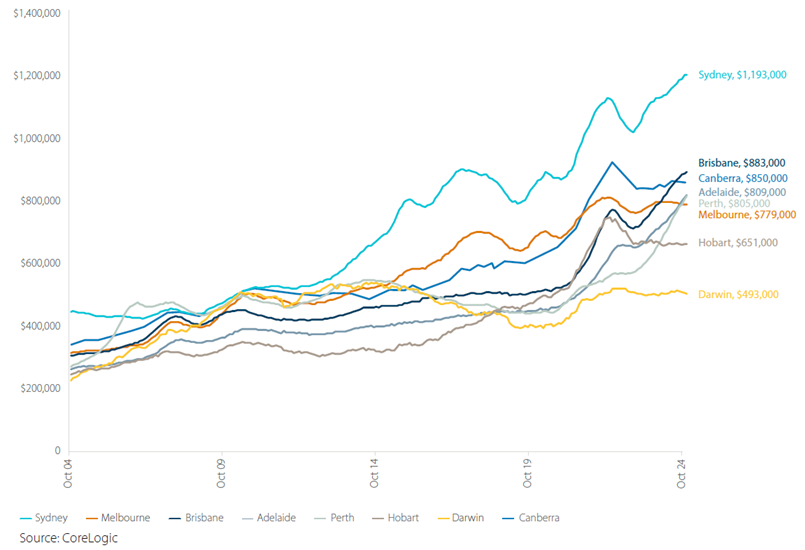
Median dwelling values

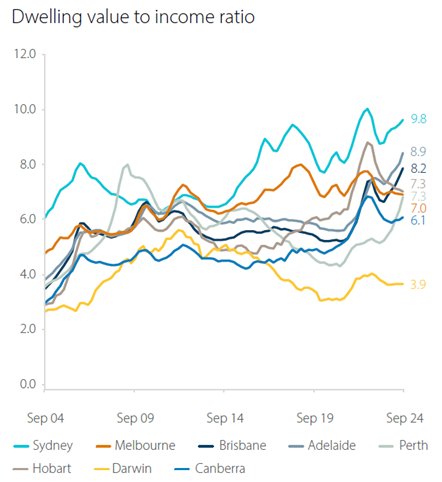
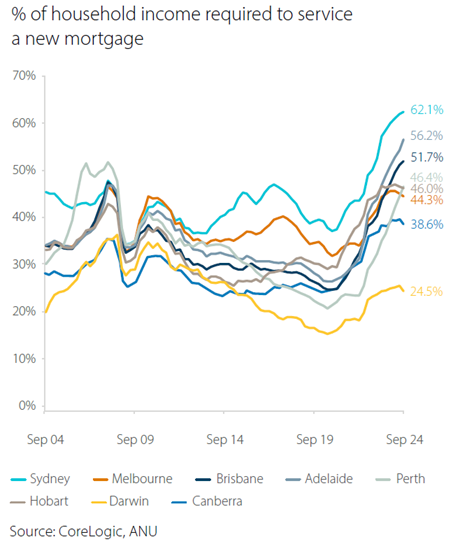
Adelaide has seen the largest deterioration in housing affordability. The median dwelling value to income ratio has risen from 5.9x in April 2020 to 8.9x now. That makes the city the second-least affordable capital city, with 56% of income needed to service a new mortgage and almost 12 years to save a 20% deposit.

It’s also harder to afford a home in Brisbane and Perth too. Brisbane is now the third least affordable city, with 52% of household income required to service a new mortgage.

Despite Sydney homes growing less than some of the smaller cities, it remains the least affordable capital city in Australia, with a dwelling value to median income ratio of 9.8x.

Meanwhile, Melbourne has become much more affordable thanks to a gloomy economy and a government mired in debt.

Will housing affordability improve next year?

The report notes that demand for housing has softened in recent months, with higher interest rates, cost of living pressures and elevated home values deterring buyers. And in some cities, such as Sydney and Melbourne, house values have started to fall.

Then it says:

“Cyclical downturns often do not lead to long-term improvements in housing affordability, because the declines eventually attract new buyers in the market.”

This seems a little naïve and based on evidence from the extraordinary housing boom over the past 40 years ie. recency bias. A broader sweep of history shows that cyclical downturns can certainly make housing more affordable, and it can take a long time before buyers step in to buy the dips.

The report goes on to suggest that affordability may improve with rate cuts ahead. ANZ forecasts 75bps of easing, starting in February next year. Assuming no change in incomes, and no upward pressure on housing values, that would reduce the national metric of income needed for a new loan from 51% to 47%.

Yet, the data in the report suggests that it’s going to need a lot more than lower rates for most Australians to be able to afford a home any time soon.


James Gruber is Editor at Firstlinks.


11 Comments
CC
December 02, 2024

Gross mismanagement by government in multiple ways over many years

Peter
November 28, 2024

If all of this analysis is correct, then who are the buyers of these unaffordable properties. Auction clearance rates have fallen but are still 60-70%. It can’t just be existing property owners trading up or down.

Dudley
November 28, 2024

The 'Shoe-Horned'. Those who can not afford but buy anyway.
Using government grants, non-commercial loans, ...

Steve
November 28, 2024

Yes always a good question. If only 10% can afford a loan to buy a median priced property, then the demand side should also be very low? After all in basic economics price is the point at which supply and demand become balanced. What seems missing is the distribution of buyers, meaning the presumption that buyers are first home buyers only (ie no existing equity), and that first home buyers are buying a property of median value. The median being used for all these calculations may be misleading, as there are a range of prices of which the median is just the price where half the houses are cheaper and half are more expensive. So 50% of houses are cheaper than the median, by definition. I'll just repeat that as its a hugely significant number - 50% of houses are cheaper than the median. Perhaps first home buyers are buying cheaper properties, building some equity and upgrading when they can afford it. For all the talk of a housing crisis, the market does not seem to be showing much sign of weakening, which should happen if only 10% could truly afford a purchase. This seems to be par for the course in these articles these days, if the problem is so huge how does the massive disconnect of 10% affordability vs still growing prices get explained? A more nuanced analysis required for that question.

Dudley
November 29, 2024

"A more nuanced analysis required for that question.":

Good points but the affordability measure being discussed is a hypothetical number 'picked from the air' after considering what remains after the other expenses of the hypothetical average (/ everyday) household.

Real households which hypothetically can not afford a hypothetical home might not stick to the hypothetical expenditure and buy a real home - which might place the household at greater real risk than assumed appropriate for the hypothetical household.

James Gruber
November 29, 2024

Steve,

I agree: the piece should have been more nuanced.

Best,
James

Dudley
November 28, 2024

"The report acknowledges that its focus on savings and income neglects other means of accessing the housing market such as selling a home already owned, using the Bank of Mum and Dad, access to Government schemes such as the First Home Guarantee, buying a cheaper home than your income would suggest you can, and so on.":

Did the report report on the "Bunk of Dad&Mum'"?
https://www.google.com/search?q=firstlinks+%22Bunk+of+Dad%26Mum%22

First task is to save faster then the increase in home price else be left in the dust.
Second task is to save fast enough to accumulate either minimum mortgage equity or full price of home within a useful time.

Saving 90% of after tax income does that. Needs free rent.

Dudley
November 28, 2024

No mention of the "Bunk of Dad&Mum" in report :

https://www.anz.com.au/newsroom/news/2024/november/november-corelogic-housing-affordability/

https://www.anz.com.au/content/dam/anzcomau/bluenotes/documents/ANZ_CoreLogic_%20Housing_Affordability%20Report_November-2024.pdf

Buying homes with all cash is not what ANZ sees as in their interest (which it pays little on savings) and CoreLogic would not benefit from a market where home prices stagnated or deflated relative to wages due to prospective home owner wage earners saving rather than bidding up home prices with other people's money.
A bit of saving before buying, resulting in home price deflation, might become fashionable.

John Cottage
November 28, 2024

sow the wind and reap the whirlwind

GeorgeB
November 28, 2024

Yes, "the wind" was dropping official rates to near zero when covid hit and "the whirlwind" is the asset bubble that followed. Hardly surprising that we are now in the midst of a housing affordability crisis.

Mart
November 28, 2024

There have been a few media articles recently on the state of Victoria's debt issue .... capped off by State Treasurer Pallas proclaiming in the AFR yesterday that everyone has got it wrong and Victoria is an economic powerhouse and the best of all the States. No doubt he'll spin "meanwhile, Melbourne has become much more affordable thanks to a gloomy economy and a government mired in debt" as the Vic Government doing something positive for housing affordability.


Leave a Comment:

banner

Most viewed in recent weeks

Raising the GST to 15%

Treasurer Jim Chalmers aims to tackle tax reform but faces challenges. Previous reviews struggled due to political sensitivities, highlighting the need for comprehensive and politically feasible change.

7 examples of how the new super tax will be calculated

You've no doubt heard about Division 296. These case studies show what people at various levels above the $3 million threshold might need to pay the ATO, with examples ranging from under $500 to more than $35,000.

Are franking credits hurting Australia’s economy?

Business investment and per capita GDP have languished over the past decade and the Labor Government is conducting inquiries to find out why. Franking credits should be part of the debate about our stalling economy.

Here's what should replace the $3 million super tax

With Div. 296 looming, is there a smarter way to tax superannuation? This proposes a fairer, income-linked alternative that respects compounding, ensures predictability, and avoids taxing unrealised capital gains. 

The rubbery numbers behind super tax concessions

In selling the super tax, Labor has repeated Treasury claims of there being $50 billion in super tax concessions annually, mostly flowing to high-income earners. This figure is vastly overstated.

9 winning investment strategies

There are many ways to invest in stocks, but some strategies are more effective than others. Here are nine tried and tested investment approaches - choosing one of these can improve your chances of reaching your financial goals.

Latest Updates

Taxation

100 Aussies: seven charts on who earns, pays, and owns

The Labor government is talking up tax reform to lift Australia’s ailing economic growth. Before any changes are made, it’s important to know who pays tax, who owns assets, and how much people have in their super for retirement.

7 key charts on the state of the Australian property market

The Australian property market stirs fierce debate - often bullish optimism versus crash predictions. But beyond the noise, seven charts reveal what's really driving prices and the outlook for residential real estate.

A simple alternative to the $3 million super tax

Division 296 aims to introduce improved fairness into the superannuation system, yet is overly complex. This scours the world for better ideas and suggests a simpler alternative which can achieve the same goals.

CBA and the index conundrum for super funds

After the hyperbolic rise in CBA shares, super funds are floating the idea of carving out the weightings of ASX bank securities and indexing them within their portfolios. This looks at why that might be a big error.

Strategy

10 policies to drive Australian productivity higher

Here's a comprehensive list of proposed reforms to fix Australia's stagnating economy, including introducing a flat income tax rate, reducing migration, and making childcare tax-deductible.

Interviews

Where to find big winners in Asia

As more money looks for a home outside the US, Asia may soon get some love. Fidelity's Anthony Srom outlines the best places in Asia to invest, including in Chinese consumer names, Indian financials, and Thailand.

Investment strategies

We have trouble understanding the time value of money

We overvalue the present and underestimate the future - it’s a cognitive glitch called hyperbolic discounting. It affects savings, spending, and loans, and it's more common - and costly - than we think. 

Sponsors

Alliances

© 2025 Morningstar, Inc. All rights reserved.

Disclaimer
The data, research and opinions provided here are for information purposes; are not an offer to buy or sell a security; and are not warranted to be correct, complete or accurate. Morningstar, its affiliates, and third-party content providers are not responsible for any investment decisions, damages or losses resulting from, or related to, the data and analyses or their use. To the extent any content is general advice, it has been prepared for clients of Morningstar Australasia Pty Ltd (ABN: 95 090 665 544, AFSL: 240892), without reference to your financial objectives, situation or needs. For more information refer to our Financial Services Guide. You should consider the advice in light of these matters and if applicable, the relevant Product Disclosure Statement before making any decision to invest. Past performance does not necessarily indicate a financial product’s future performance. To obtain advice tailored to your situation, contact a professional financial adviser. Articles are current as at date of publication.
This website contains information and opinions provided by third parties. Inclusion of this information does not necessarily represent Morningstar’s positions, strategies or opinions and should not be considered an endorsement by Morningstar.