Access to franking credits is generally thought to make investing in Australian stocks more attractive. Does it follow that that Australian companies paying franked dividends offer higher after-tax returns as a consequence? I explain why this is probably, but not necessarily, the case. The nub of the issue is whether franking credits are associated with an offset in terms of lower pre-tax expected returns.
Nature of franking credits
Franking credits might be conceptualised as a prepayment of income tax made by the company on behalf of the investor. This prepayment occurs only with respect to fully-taxed Australian company profits out of which a dividend is paid, which the investor then includes in their tax return as a franking credit. The investor effectively either tops up the tax or receives a credit that adjusts the tax paid on the underlying company profits from an assumed 30% to their personal marginal tax rate.
This means that an investor on a marginal tax rate of (say) 45% pays an additional income tax of 15%. Superannuation funds pay a 15% tax on income and hence get a tax credit of 15%. And those on a tax rate of 0% – such as retirees or charities – can claim the franking credit back from the ATO in cash.
First up … don’t forget about the alternatives
Franking credits effectively put a stop on double taxation of Australian corporate profits, under which company profits are first taxed at the company level and again when distributed as dividends. The dividend imputation system thus places investing in companies that pay Australian corporate taxes on the same footing as other investments where the income is distributed to investors and taxed in their hands, such as fixed income and REITs (as well as managed funds). From this perspective, the imputation system addresses a potential distortion rather than necessarily creating an advantage.
However, franking may create an advantage over investing in companies where double taxation can still apply, including international stocks and Australian companies that pay unfranked dividends say due to overseas earnings. In some cases, such companies pay lower dividends and deliver more in capital gains, where the investor is taxed at half their marginal tax rate and may defer the payment of the tax and possibly avoid it by waiting until retirement to sell. This complicates the comparison.
The key message is that, if you have money to invest, the existence of franking credits does not automatically make Australian stocks paying fully franked dividends more attractive. Expected return and risk on all available investments still needs to be weighed up. No point in holding Australian companies purely because they pay franking credits if other investments are more attractive after any tax effects are considered.
Where franking credits are available, do investors necessarily benefit?
Franking credits appear to offer an additional source of value to Australian investors. Does this mean that Australian stocks paying franked dividends offer higher expected returns? Not necessarily. It depends on the extent to which franking credits are priced. Which leads to the question of how share prices are determined.
Here is a simple thought experiment to set the context. Consider a stock that offers franking credits equal to 2% of the price. (I shall call this a ‘franking credit yield’ or FCY, which is the difference between the gross and net dividend yield.) And say that all investors agree that the ‘fair’ return for the stock is 10% after tax. One extreme is where prices are set by an Australian investor who places full value on the franking credits. The stock would then be priced to deliver an 8% expected market return (comprising capital gains plus net dividends), with that investor getting their 10% required return by including the 2% franking credit. Investors who cannot utilise the franking credits only get 8%. The other extreme is where franking credits are unpriced, so that the stock is priced to deliver a 10% expected market return. The Australian investor gets 12% including the 2% franking credit. In the former situation, franking offers no return benefit to the Australian investor. In the latter, franking provides a return bonus.
The question then is how market prices are determined when investors differ in the benefit they receive from any franking credits. While some researchers approach this issue by applying a weighted average, I suggest that identifying the marginal investor is more in accordance with economic theory. This perspective suggests a ‘demand curve’ that looks something like the ladder plotted in the chart below of the market return required by different investors to deliver them a 10% return after applying income tax on the dividends allowing for franking credits.
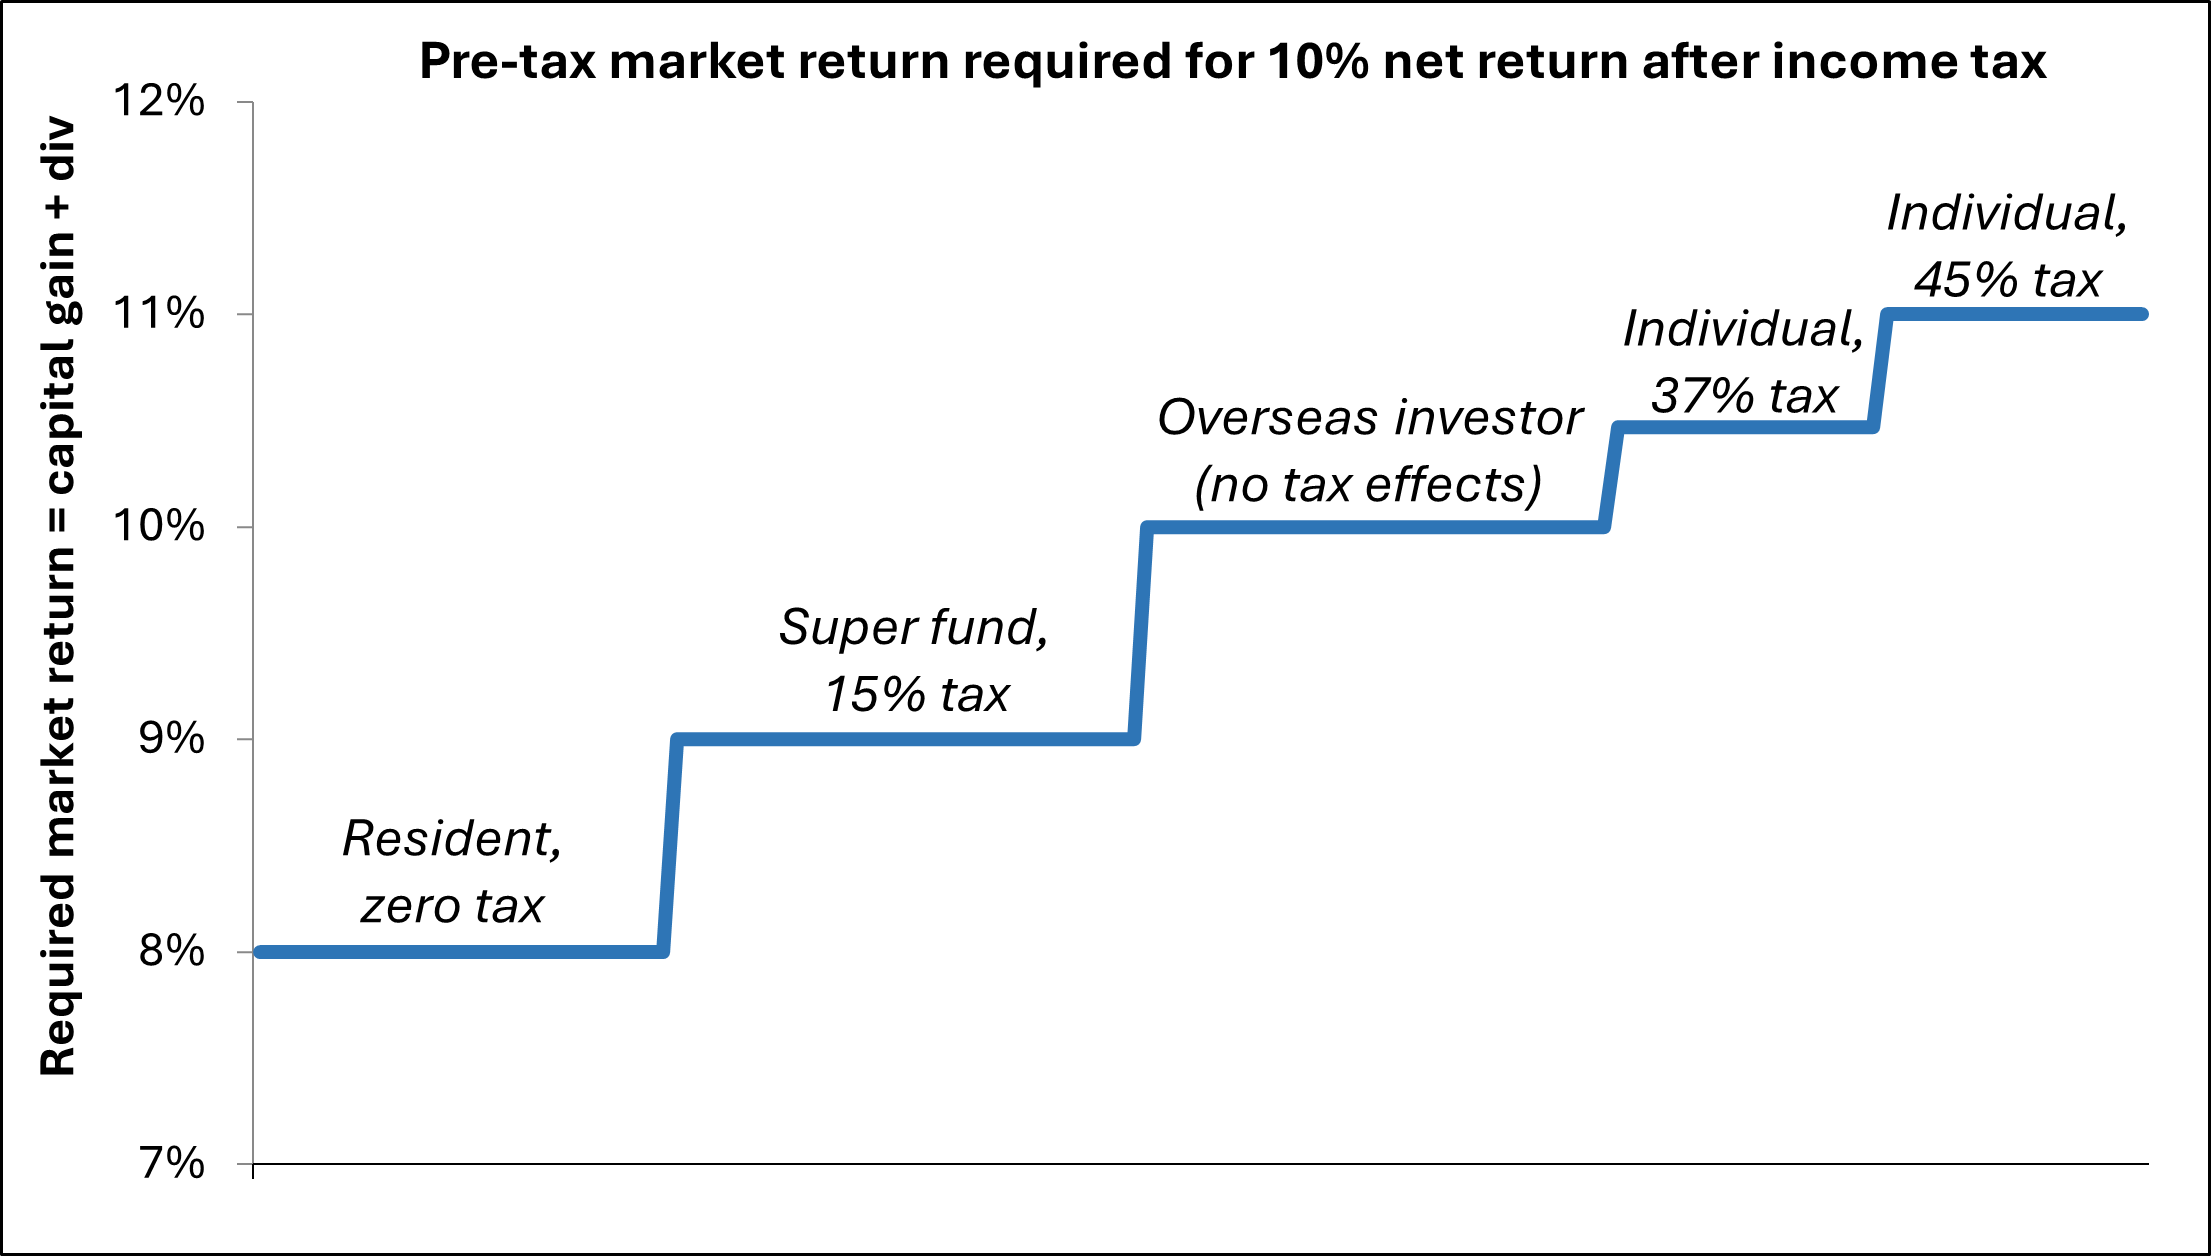
So, who sets the price? It might be any of these investors, depending on the time and situation. In any event, two things are required for franking credits to offer an additional return bonus. First is that they are NOT fully priced, i.e. not set by a low tax paying resident. Second, you are an investor that sits lower on the ladder than whoever happens to be setting the price. For instance, if overseas investors are the price setters, both super funds and zero-tax residents should benefit from franking credits.
Evidence around the pricing of franking credits
Numerous researchers have tried to tease out the extent to which franking credits are priced. Four methods have been used:
- Dividend drop-off studies that estimate the value of franking by observing the price drop-off that occurs when a stock goes ex-dividend to establish if the presence of franking credits have an effect.
- Comparative pricing studies infer the value of franking credits by comparing differences in the pricing of comparable securities that various in their entitlement to franking credits, e.g. certain derivatives, stocks with overseas and Australian listings.
- Studies examining returns that aim to establish if stocks paying franked dividends generate lower realised returns than otherwise expected.
- Studies focusing on share price levels that focus on whether stocks paying franked dividends are more highly priced using valuation models.
While the findings are mixed, they generally come down on the side that franking credits are somewhere between unpriced and partially priced. This is hopeful for investors on lower tax rates, in particular zero-tax payers and probably super funds.
Could the pricing of franking credits have changed?
One question is whether the extent to which franking credits are priced may have changed over time, perhaps due to the rising influence of superannuation funds in Australian markets. For instance, one wonders whether super funds and other investors seeking franking credits may have contributed to a shift in how Australian banks are being priced.
I investigated by examining how consensus forward P/E ratios (or earnings yields, i.e. E/P) vary with FCY (franking credits / price) over time. The intuition is that, if franking credits are priced by the market, then stocks offering higher FCY should trade on higher PEs (lower E/P) all else held constant. Further, if the value placed on franking credits has increased over time, the relationship should have shifted.
I examined the data from a variety of perspectives, including analysing P/Es for stocks sorted by FCY and FCY for stocks sorted by P/E, double-sorting on both variables, running models (regressions) that control for other determinants of P/Es, and cutting the data along industry sector lines. The consistent result was that a higher FCY tends to be associated with lower (not higher) P/Es, and that this relationship has not changed meaningfully over time.
The chart below illustrates this[1]. The P/Es for stocks offering higher FCYs of 2-3% and 3-4% as appearing in green are lower than the PEs for stocks on lower FCYs 0-1% and 1-2% appearing in blue. Stocks with zero franking sit in the middle. And there are no obvious trends over time. Although this is simplistic analysis, one might expect to see some clear trends if the pricing of franking credit had changed.
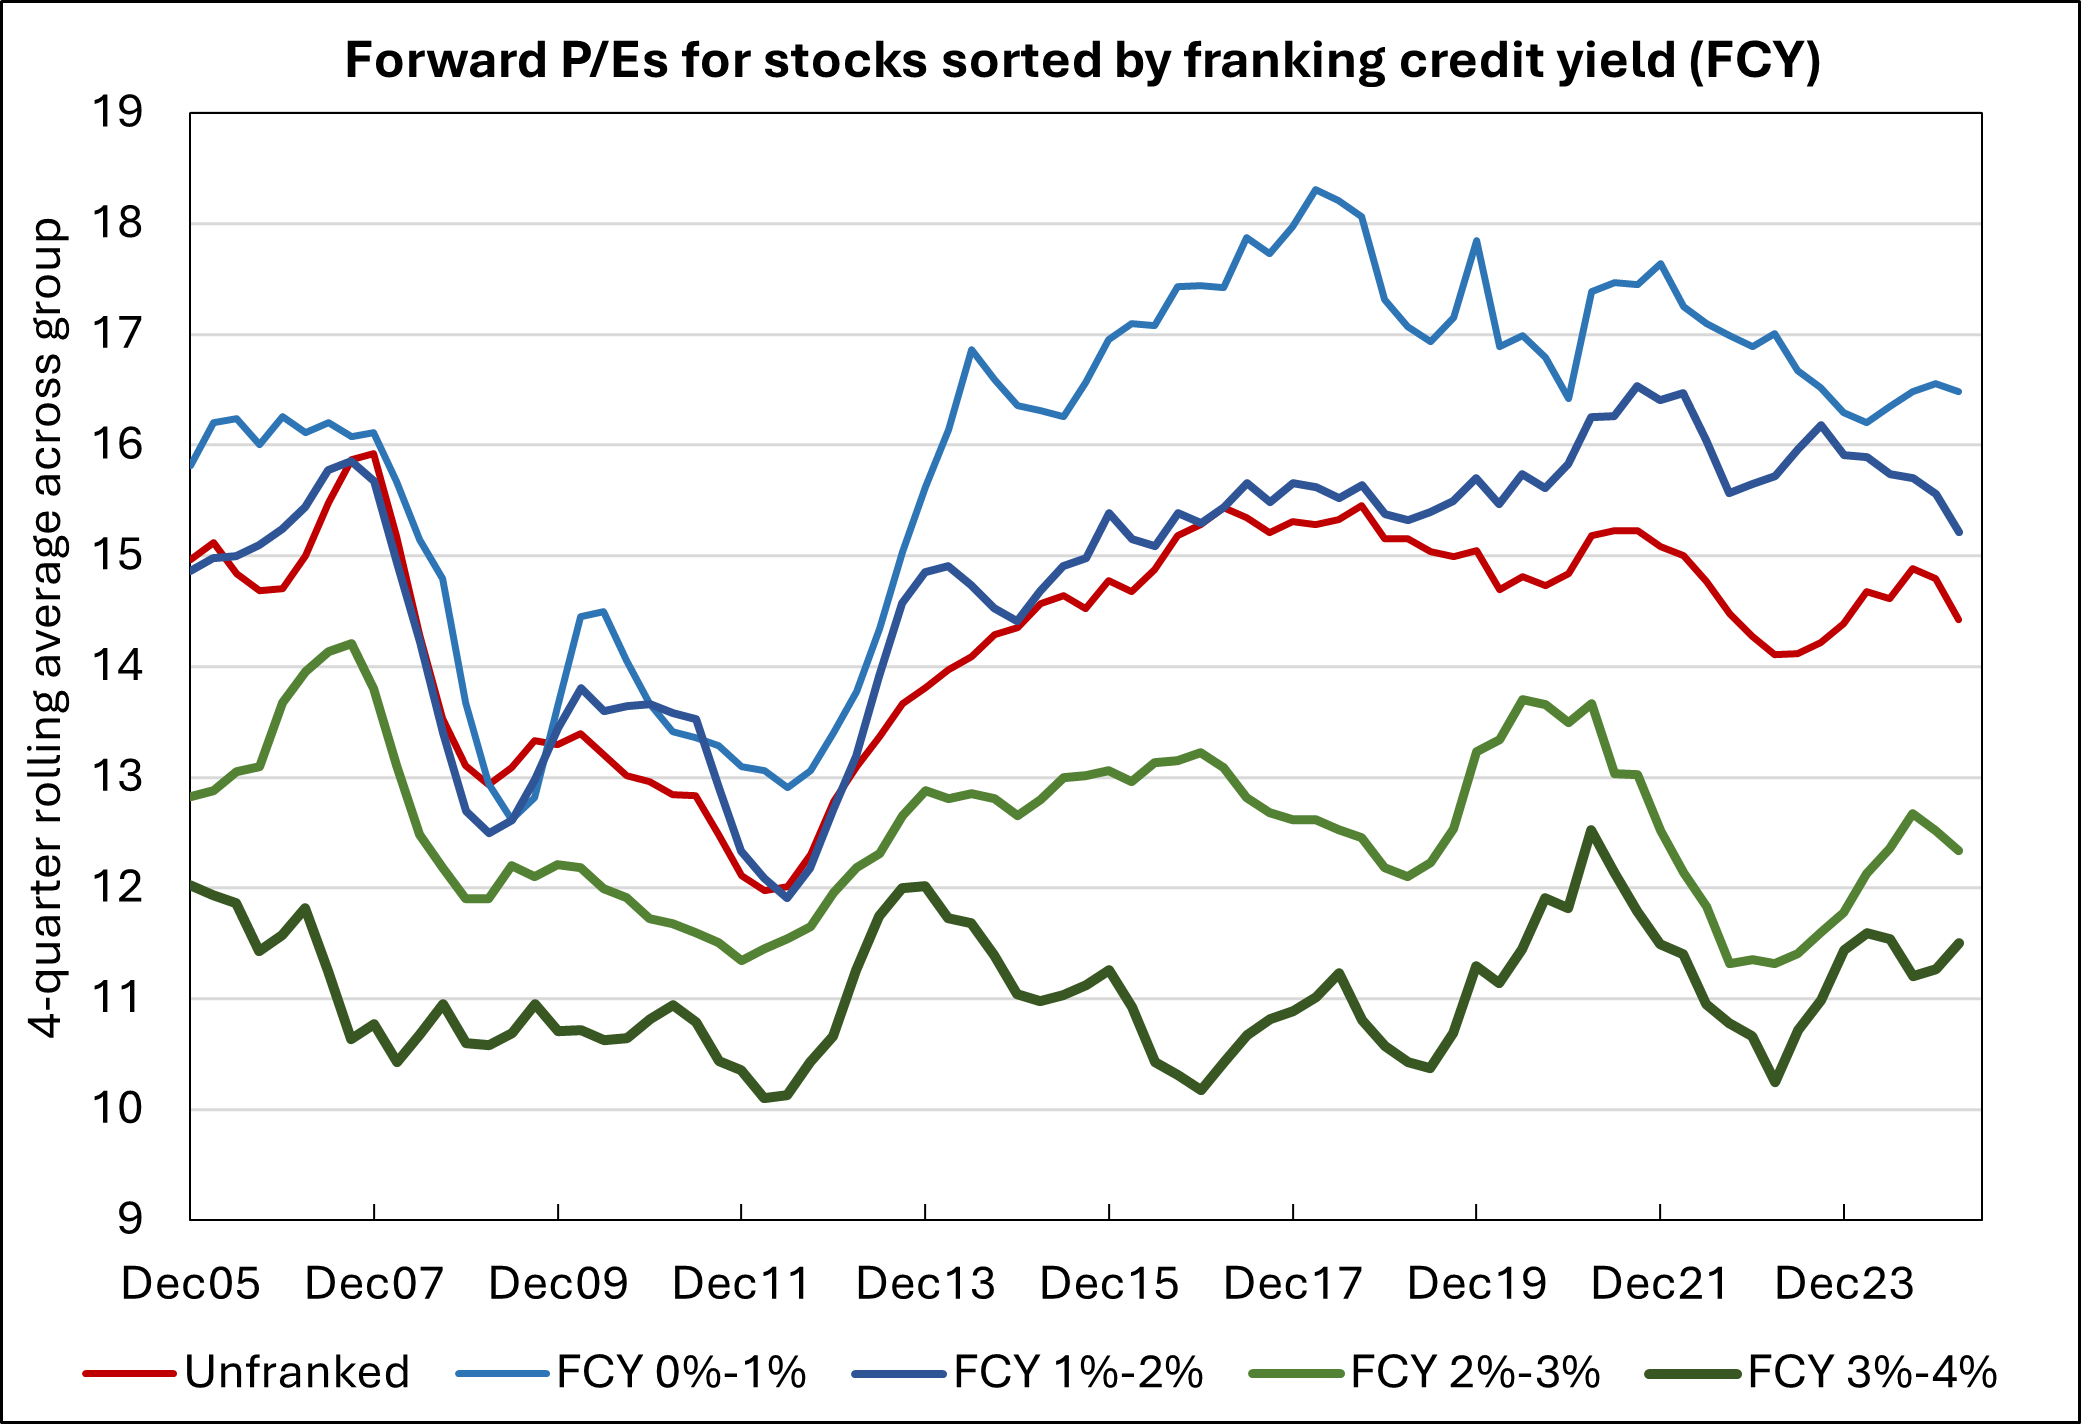
The relationship between FCY and P/Es is in a sense unsurprising. It simply means that stocks on lower P/Es and thus higher E/Ps not only deliver more earnings per $ of share price but are also likely to distribute more franking credits per $ of share price. Greater earnings mean greater dividends and greater franking, at least for companies that pay Australian corporate tax.
Applying an investor lens
The implication is that stocks that are ‘cheap’ on a P/E basis are prone to pay more franking credits. This opens up the prospect for investors to buy stocks that could be ‘cheap’ AND receive an additional return kicker from franking credits. Good news for value-based investors, especially those who prefer income. (See Does dividend investing make sense? for my discussion of the merits of income investing.)
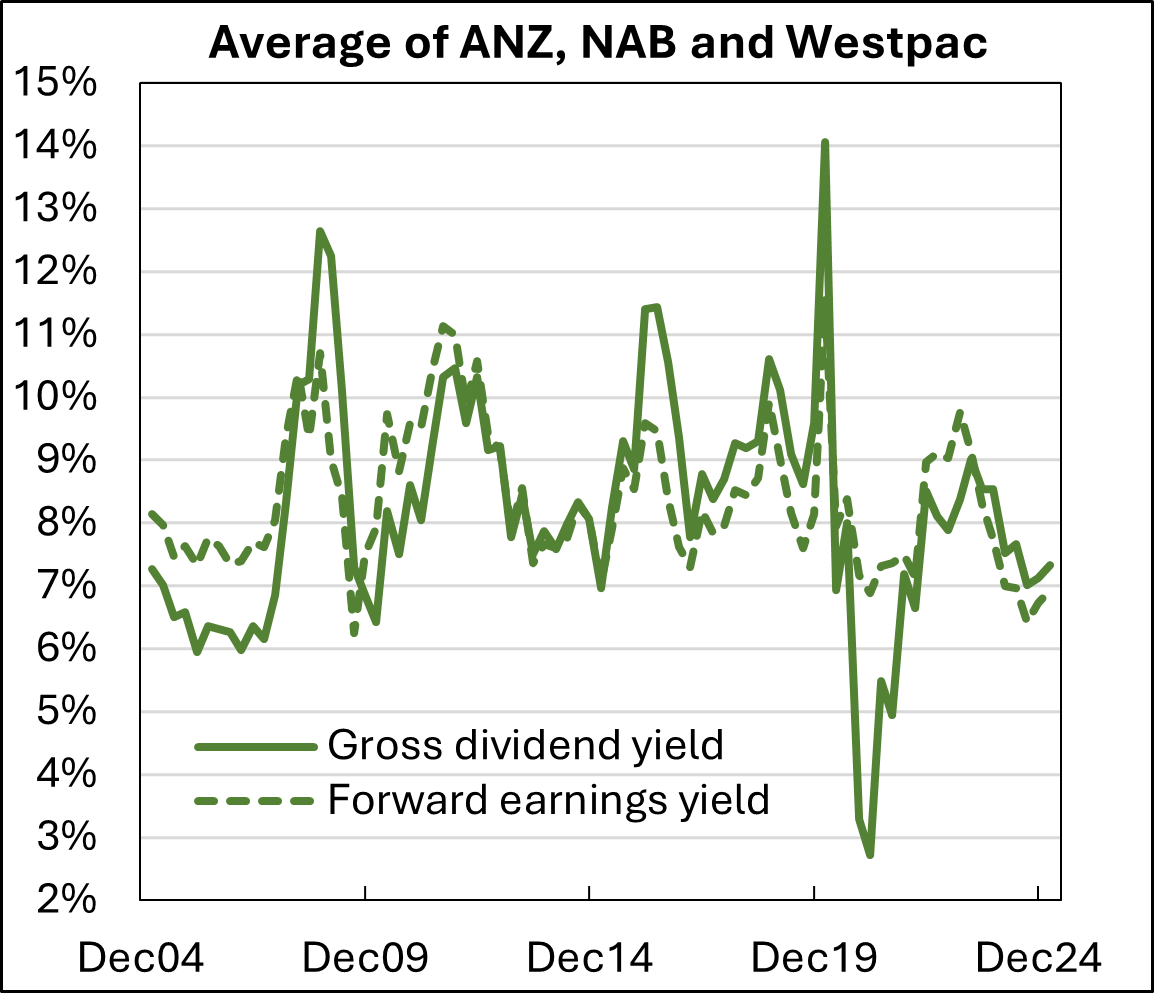
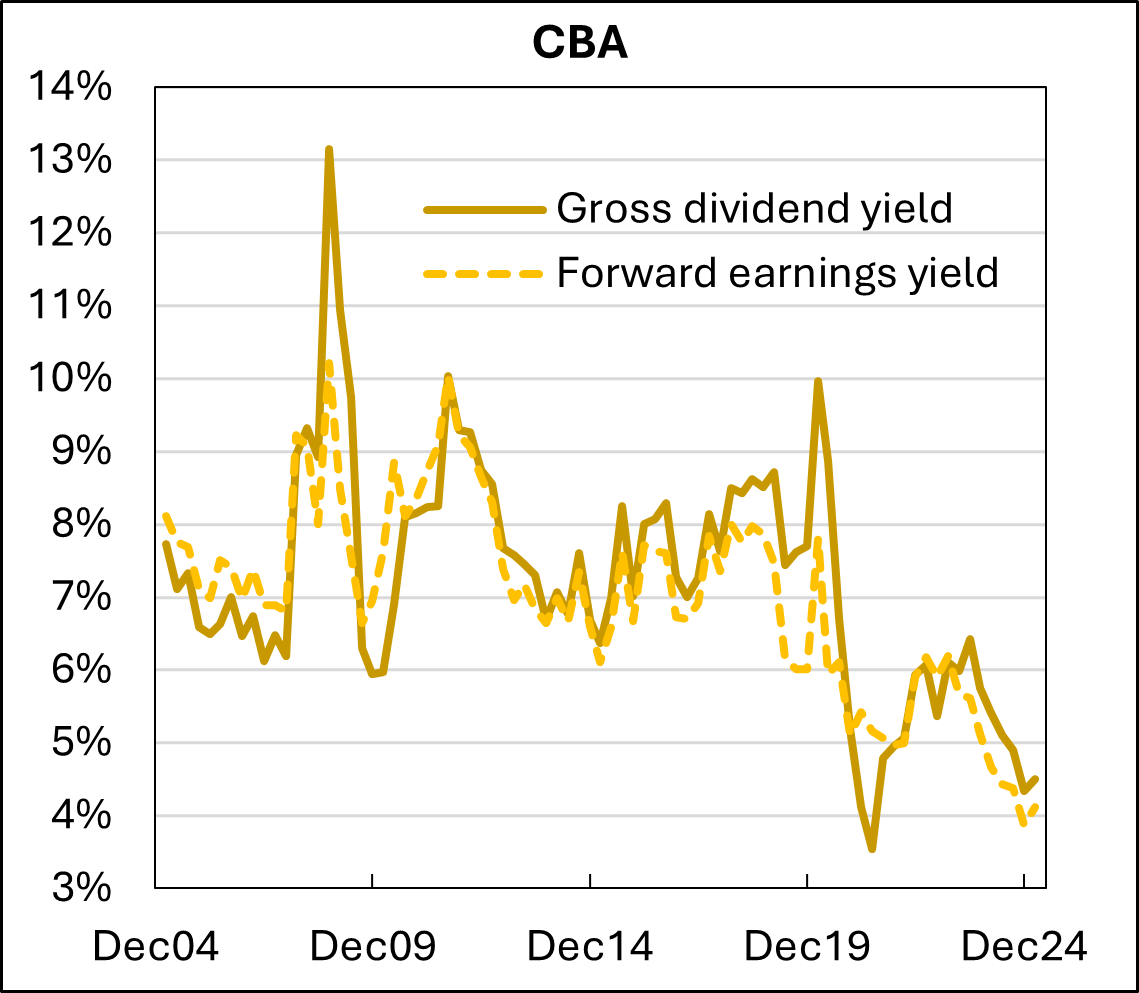
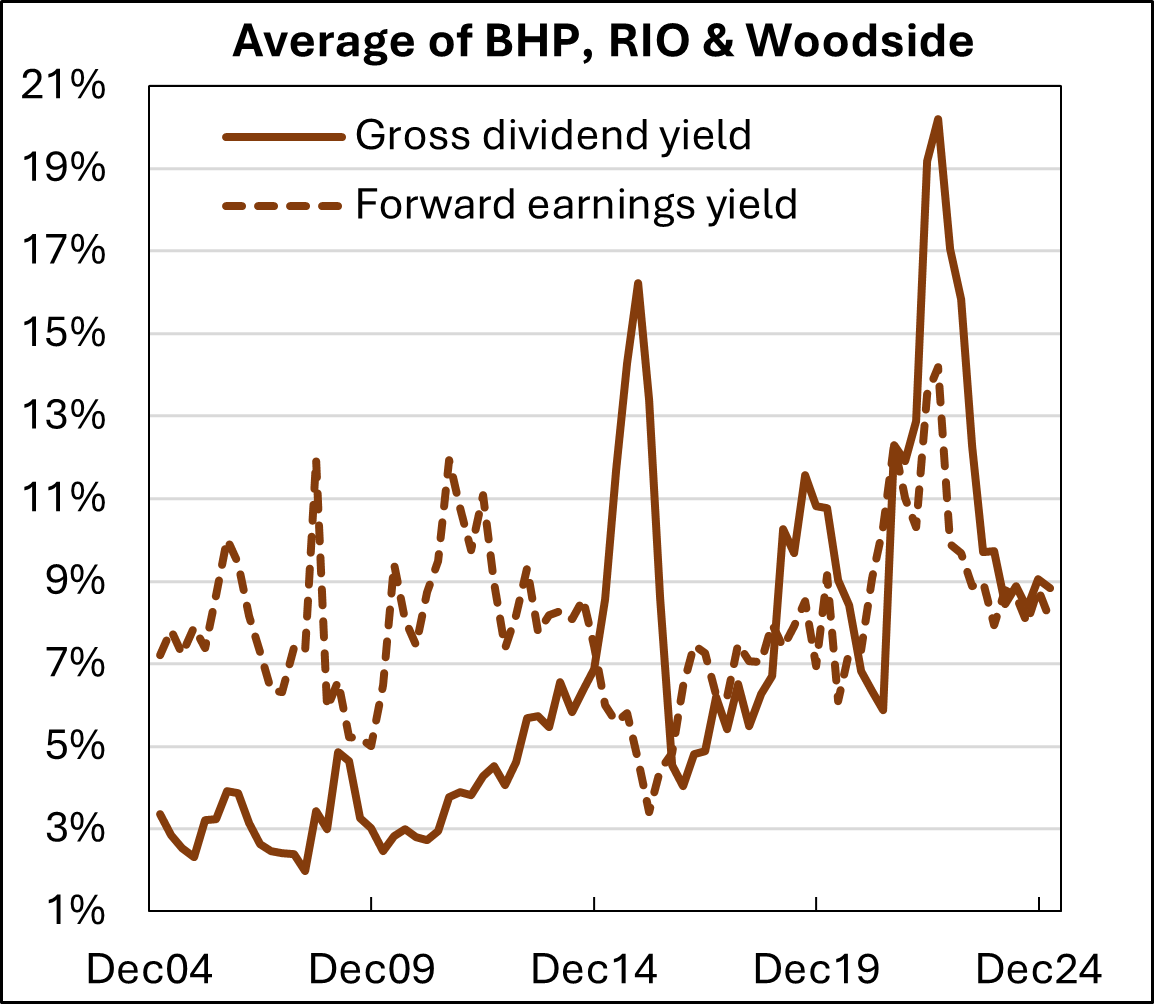
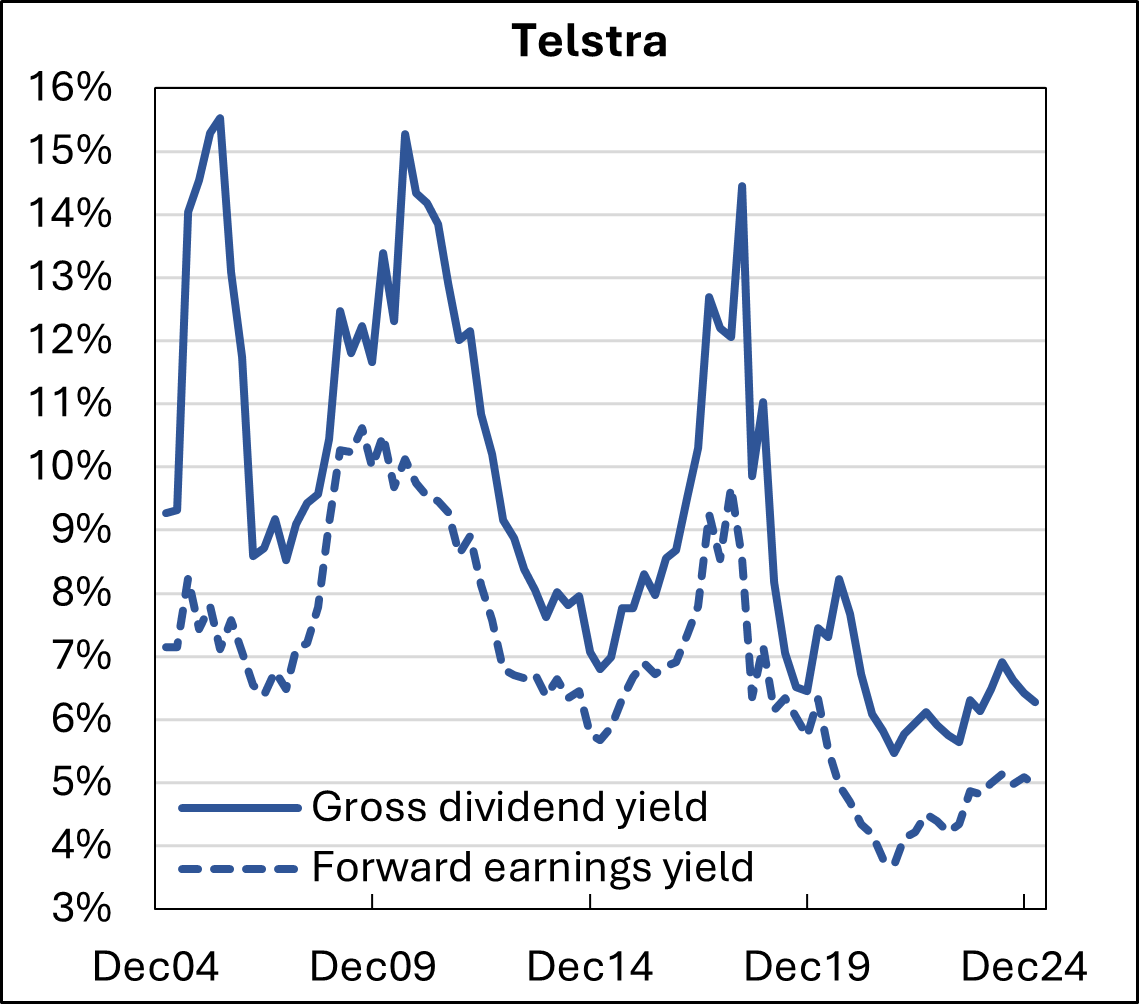
It also means that the benefit from franking credits might fluctuate over time as stocks are repriced by the market. The panel of charts below plots gross dividend yield versus E/P for some traditional sources of fully-franked dividends in the Australian market, namely the big banks, the large resource stocks and Telstra. It is clear that E/P and gross dividend yield (and hence FCY) are closely related. And that these traditional sources of franking credits are not what they used to be, most notably in the case of CBA[2].
|
Forward earnings yield vs. gross dividend yield
|
|
|
|
|
|
|
I am not suggesting that low P/Es coupled with a generous FCY suffices as investment criteria. Far from it. It is still important to invest in good companies at reasonable prices. Low P/Es stocks are not necessarily good investments. Nor are high P/E stocks necessarily bad investments. I am merely pointing out that lower P/E stocks can often be associated with higher franking credits, and this component may act as a type of bonus return over that delivered by the market.
Where this all leaves us
The message is that franking credits deserve consideration and are probably worth pursuing. The evidence suggests that franking is at worst partly priced and possibly unpriced, and that some stocks paying franked dividends might also be relatively cheap. Nevertheless, franking credits are not enough in themselves. Pursuit of franking credits should be secondary to investing in good companies ideally at reasonable prices. Similarly, generous weightings to Australian equities purely to capture franking credits becomes questionable if other assets offer more attractive returns. As usual, there are rarely hard and fast rules when it comes to investing.
* A special thanks to RQI’s David Walsh and Ned Guan for providing the data that forms the basis for this article.
Geoff Warren is a Research Fellow with The Conexus Institute, and an Honorary Associate Professor at the Australian National University.
[1] We filtered the data to include companies trading on an E/P of between 3% (P/E of 33.3) and 13% (P/E of 7.6), to capture a sample where the P/E ratio is likely to be meaningful.
[2] Some investors might take the view that they purchased CBA at much lower prices and are receiving a good fully-franked yield on their initial investment. Sure. Nevertheless, I suggest there is a better way to look at the issue than anchoring on the initial entry price. This is to consider whether one might be better off selling and reinvesting in another stock on a lower P/E that offers much higher gross dividends. While an investor might not be better off after paying capital gains tax, at least it seems the right question to ask.