GLI dividend yields attractive in absolute terms and relative to history
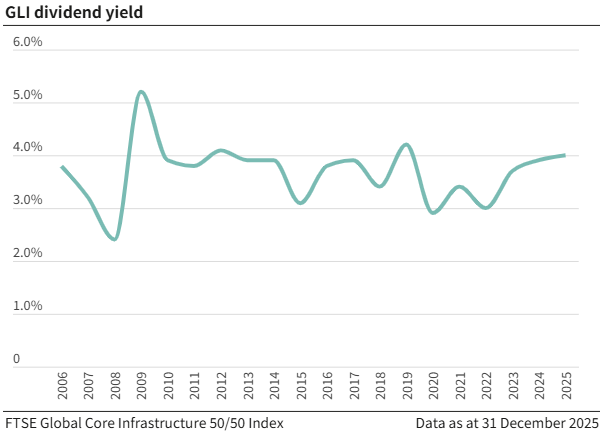
For over twenty years, the global listed infrastructure asset class (GLI) has consistently generated dividend yields in the 3%-4% range. As valuation multiples have declined in the past few years, dividend yields have expanded into the upper half of this range.
The sustainability of these returns remains underpinned by stable demand for infrastructure, established cash-generative business models and sensible dividend payout ratios1. With the US and UK economies expecting further interest rate reductions in 2026, this should support the appeal of GLI dividend yields going forward.
Dividends have ample scope to grow (not fixed coupons)
Whilst the headline dividend yield is attractive, the more exciting aspect is that rather than remaining fixed, like most bond coupons, asset class dividends have scope to grow over time. There are multiple facets to dividend growth: organic earnings growth (including inflation-linkage), increasing payout ratios, and the possibility of special dividend payments.
Organic earnings growth
The First Sentier Investors Global Listed Infrastructure team’s definition of infrastructure includes sustainable growth alongside pricing power, high barriers to entry and predictable cash flow. The ability to grow earnings steadily over time, with less sensitivity than general equities to the broader economic cycle, is a key characteristic of GLI and one that we find most compelling about the asset class.
Growing demand for infrastructure services comes from myriad sources; electricity network upgrades for electrification and decarbonisation, exponential growth in power demand from artificial intelligence (AI) training and inference, the increasing popularity of air travel from rising disposable incomes and shifting consumption preferences, and mobile data demand growth to name a few.
Many infrastructure assets have explicit links to inflation through regulation, concession agreements or contracts. Other assets without an explicit link often have the pricing power to deliver similar (or better) outcomes. This reflects their strong strategic position which limits competition.
We estimate that over 70% of the assets we invest in have the ability to pass inflation through to the end-customer.
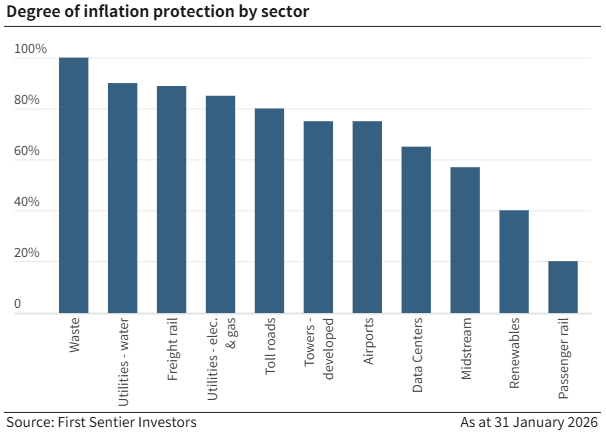
Combining these volume and pricing drivers with essential service, hard-to-replicate business models means that this top-line growth typically translates to earnings, cashflow and ultimately dividend growth. Regulated utilities and selected toll road companies provide good examples of this dynamic, with visible and resilient earnings growth coupled with plans to increase dividends over time. For example, the UK regulated utility sector aims to grow dividends by inflation on a yearly basis. As such, dividends form an important part of the total return proposition for many companies in these sectors.
In aggregate, we anticipate GLI dividends will grow at an annualised rate of approximately 5% to 6%2 over the next two years.
Increasing payout ratios
Directional improvements in corporate governance and an increased focus on shareholder value have supported an expansion of dividend payout ratios over time. Japanese and Chinese stock markets have been relatively recent adoptees of these practices. As a result, we have seen Japanese passenger railway operators (East Japan Railway’s dividend payout ratio from 30% in FY25 to 40% by FY28) and the largest listed Chinese tower company (from 72% in 2022 to 76% in 2024) grow their payout ratios in the past few years. Looking forward, we expect Japan Airport Terminal and perhaps Beijing Airport to improve their respective shareholder return policies.
As infrastructure sectors mature and transition from an inorganic growth phase to predominantly organic growth drivers, we see scope for companies to increase shareholder returns as they work to optimise their balance sheets. Developed market towers are a prime example of this, with European operators setting multi-year dividend growth targets of between 5% and 7% per annum. American Liquefied Natural Gas export terminal pioneer Cheniere Energy has committed to growing its dividend by 10% per annum until the end of the decade. Targeting a very modest 20% payout ratio, we believe this growth rate could be expanded as additional trains3 complete construction and start to generate cash flows.
Lastly, as airports complete large and lumpy expansion projects, they enter a free cash flow cycle and become increasingly prone to increasing dividends. For example, in March 2025, Zurich Airport expanded its payout ratio from 40% of net profit to 50% with a further 25% payout if leverage drops below certain thresholds. Looking ahead, as German airport operator Fraport nears completion of the new Terminal 3 at Frankfurt Airport, the company is considering resuming dividend payments in 2026.
Special dividends
While – by their very definition – not as enduring as normal dividends, special dividends have a role to play in the GLI capital return toolkit, enabling companies to generate shareholder returns without reducing liquidity in the way that share buybacks can. It was pleasing to see Mexican airport, ASUR, return value to shareholders by paying an extraordinary dividend in early 2025.
Sometimes associated with asset disposals, special dividends give management teams the flexibility to reduce excess capital without committing to unsustainable payouts over longer time frames. The recent sale of port assets by Mexican transport infrastructure operator PINFRA, and the anticipated merger of Chinese gas utility ENN Energy, if completed, should see significant special dividends being paid by both companies.
Buybacks are the cherry on top
We believe the headline dividend yield doesn’t adequately reflect, and in fact understates, the remuneration available to global listed infrastructure shareholders. Buybacks or share repurchases are the icing on the cake in the capital management toolkit of management teams looking to opportunistically or programmatically return capital to shareholders.
Frustratingly, they do not appear in the form of dividends (or income), which we appreciate are important for many investors. Buybacks typically boost earnings per share or cashflow per share which supports the total return. As fundamentals-focused, bottom-up investors, we are generally indifferent between return of capital via dividends or through buybacks: we love both! We think buybacks make sense when listed companies trade at a discount to intrinsic value or when there is a lack of compelling risk-adjusted capital investment opportunities.
Conceptually, non-utility infrastructure companies are well placed to return capital over time: large upfront capital investment into an asset that offers an essential service followed by a multi-year period of free cashflow harvesting. Within the GLI opportunity set, energy midstream, toll roads and towers provide particularly good examples of assets with low maintenance capex needs (and hence high free cash flow).
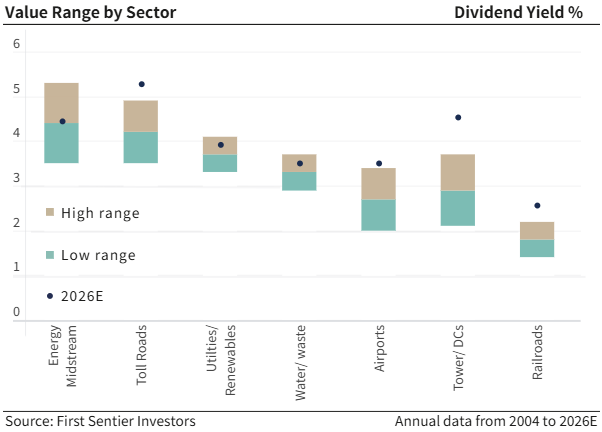
In line with this approach, US towers have established multi-billion-dollar buyback authorisations. SBA Communications and American Tower opportunistically repurchased shares in 2025, with a planned buyback from peer Crown Castle expected to follow. SBA has repurchased approximately 2.5% of Shares on Issue per annum over the past decade. Natural Gas Liquids infrastructure provider Targa Resources uses a combination of buybacks and dividends to form their shareholder remuneration.
Furthermore, in the most economically-sensitive sectors of GLI – freight railroads and waste management – buybacks form a large part of the return equation whilst offering flexibility to buffer against fluctuations in freight demand. While North American railroad dividend yields and payout ratios have been (relatively) low historically; share repurchases have regularly occurred over the past decade, typically representing between 3% and 5% of Shares on Issue per annum. Periods where this has not occurred have been after company-defining acquisitions such as the merger of Canadian Pacific and Kansas City Southern in 2023 and the recently-announced merger between Union Pacific and Norfolk Southern. With Union Pacific forecasting a resumption of buybacks in 2028, we eagerly anticipate this trend continuing.
Japanese gas utilities’ greater focus on capital efficiency and Return On Equity targets have seen the three largest listed stocks initiate or upsize buyback programs in the past two years. The size of the annual buybacks have been multiples of their dividend payments, which reinforces our belief that dividend yield is not the only metric by which shareholder returns should be measured.
Conclusion
Healthy shareholder income underpins the total return proposition of global listed infrastructure. With a dividend yield in the upper half of the historic 3%-4% range and growing owing to earnings growth, inflation linkage and improving capital efficiency, alongside potential share buybacks, we believe GLI’s income is well worth considering.
1 The proportion of a company’s earnings that is paid to shareholders as dividends
2 Simple average of GLI universe, 2026-27, Bloomberg
3 LNG trains are large-scale processing units that cool and condense natural gas into a liquid.
Edmund Leung, CFA is a Senior Portfolio Manager, Global Listed Infrastructure at First Sentier Investors (Australia) Ltd, a sponsor of Firstlinks. This material contains general information only. It is not intended to provide you with financial product advice and does not take into account your objectives, financial situation or needs.
For more articles and papers from First Sentier Investors, please click here.