Recently, I wrote an article asking whether Listed Investment Companies (LICs) are licked. I concluded that LICs faced a challenging future given waning structural demand. That said, NAV discounts for them could narrow in the short term as interest rates fell.
In response to the article, subscriber Steve made this comment:
“… it would seem there is a need for a balanced comparison of the two [LICs and ETFs] to try and settle a few arguments that are bubbling along here. Would the author (James) consider a follow up article perhaps simply comparing say the top 5 LIC's (by capitalisation) with the top 5 ETF's (presuming a similar investment universe of ASX200 companies) for (a) total return, including franking credits, (b) total income, including franking credits and (c) price return over say 5 and 10 years. The only caveat I would throw in is that similar index funds should produce similar returns (by definition) so maybe throw in a couple of smart beta ETF's (eg AQLT, MVW or some of the dividend focused ETF's) to diversify the ETF offerings even if outside the top 5.”
This piece takes up Steve’s suggestion.
First though, it’s worth noting that NAV discounts for LICs continue to narrow.
LIC premium/discount based on investment mandate (market cap weighted)
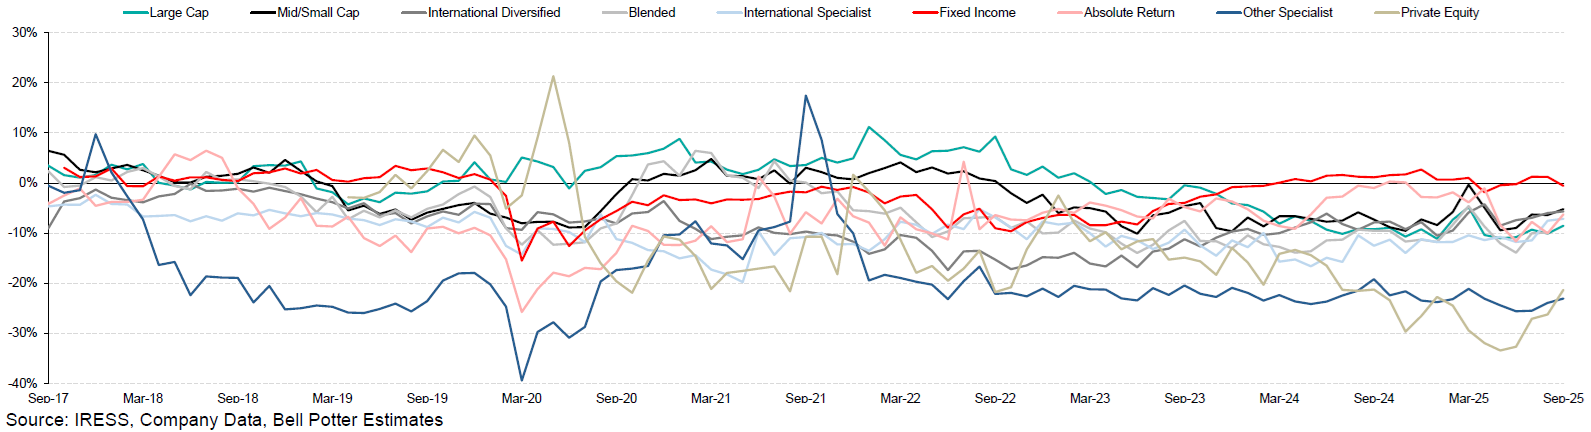
Click to enlarge
The next chart shows NAV premiums and discounts for the LICs with a market capitalisation of more than $500 million.
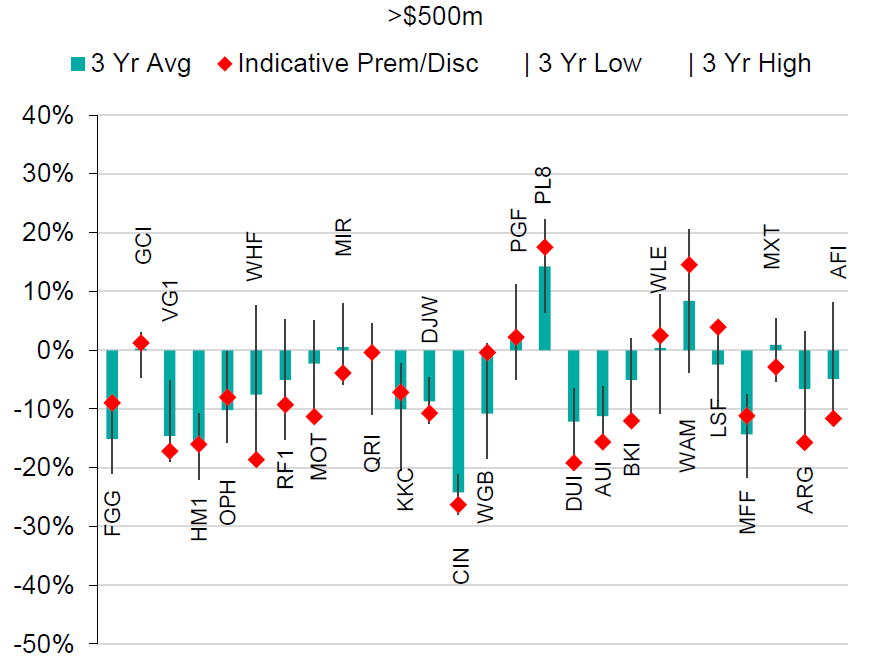
Source: Bell Potter
What this shows is that several LIC large caps are getting more love from investors, including Plato Income Maximiser (PL8), WAM Leaders (WLE), WAM Capital (WAM), MFF (MFF), Future Generation Global (FGG).
Yet, there are some notable laggards, such as Australian Foundation Investment (AFI), Argo (ARG), BKI Investment (BKI), and Australian United Investment (AUI).
Australian equity LIC and ETF performance – comparing the pair
Let’s move past NAV premiums and discounts and look at how LIC performance stacks up against comparable ETF products.
The following table takes the pre-tax net tangible asset (NTA) performance of major Australian equity LICs and compares that to various ETFs and indices.
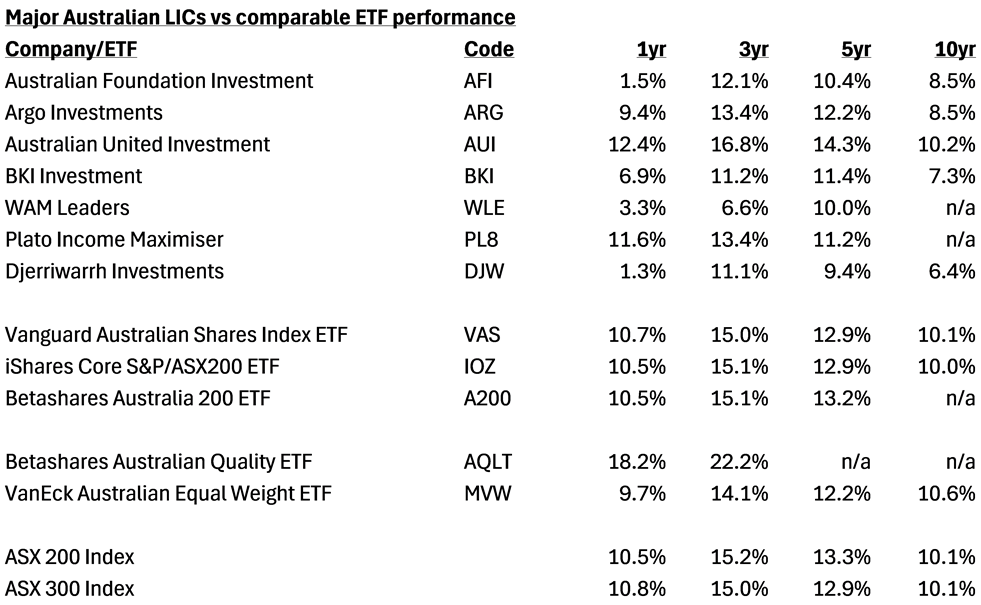
Note: LIC performance is pretax NTA per annum, and assumes reinvestment of net dividends, but does not incorporate franking. ETFs are post fees, pre-tax. The performance figures are through to end Sept. Source: Bell Potter
The table essentially isolates the investment performance of LICs over various timeframes. And the results aren’t flattering to LICs.
Only two of the seven major Australian equity LICs beat comparable ETFs and indices over the past 12 months, namely Australian United Investment and Plato Income Maximiser. Over three, five, and seven years, there’s just one LIC that has superior performance against those ETFs and indices: Australian United Investment.
The granddaddy of Aussie LICs, AFIC, has badly trailed indices over the past year, and over long time periods. Recently, it’s suffered from being underweight CBA and gold stocks. However, it’s also held onto some notable ‘losers’ like James Hardie, Reece, IDP and CSL.
Other heavyweights such as Argo and BKI have also significantly lagged indices and ETFs over all time frames.
Amazingly, the WAM Leaders fund has put up poor performance over one, three, and five years, yet as chart two in this article shows, it still manages to trade at a premium to NAV.
Plato Income Maximiser focuses on dividend stocks, and has been a reasonable performer, albeit it’s still trailed comparable indices over all time periods. With investor hunger for income, though, the stock trades at punchy 17% premium to pre-tax NTA.
Australian United Investment has been the best performer of the large cap Australian equity LICs. I don’t know a lot about this LIC and the company presentations don’t seem to offer detailed information on its largest holdings. However, it’s worth noting that AUI uses both options and leverage, which can enhance returns (and potentially detract from them too).
It should be said that the LICs themselves don’t all compare themselves to the same benchmark. Six of the seven benchmark themselves against the ASX 200. The only one that doesn’t is BKI, which compares itself against the ASX 300.
Also, the largest ETF, the Vanguard Australian Shares Index ETF, tracks the ASX 300, unlike other peers in the table.
The LICs will point to several factors for their recent underperformance. Notably, most have been underweight CBA and the banks, and they’ve paid a price for that. It’s less of an excuse when it comes to long-term performance, and that’s where scrutiny should fall on the LICs.
The next table shows the share price performance of the Australian equity LICs against the same ETFs and indices.
Obviously, share prices can differ from NTAs, though the overall picture for LICs isn’t pretty either.
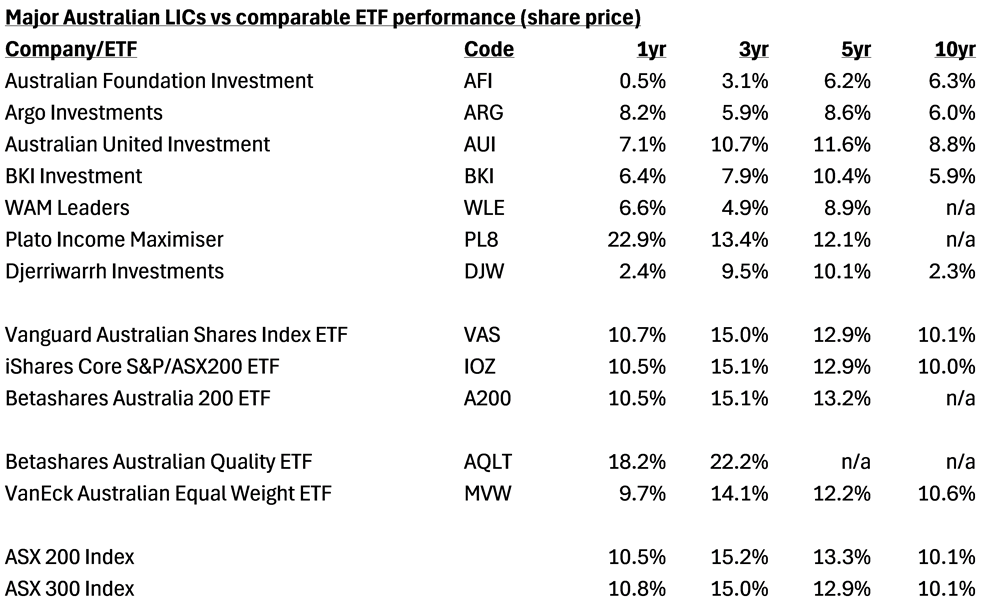
Note: The performance figures are through to end Sept. Source: Bell Potter
Only one of the major LICs has outperformed comparable ETFs and indices over the past year – Plato Income Maximiser. Plato has benefited from superior investment performance as well as a widening in the premium of its share price to NTA.
Yet, over three, five, and 10 years, all the LICs have underperformed the ETFs and indices. Australian United Investment did well with its investment returns though suffered from an increased discount of NTA to share price.
International equity LIC and ETF performance – comparing the pair
Here’s the same exercise for international stock LICs.
First, let’s see the investment performance of these large cap LICs versus comparable ETFs and indices.
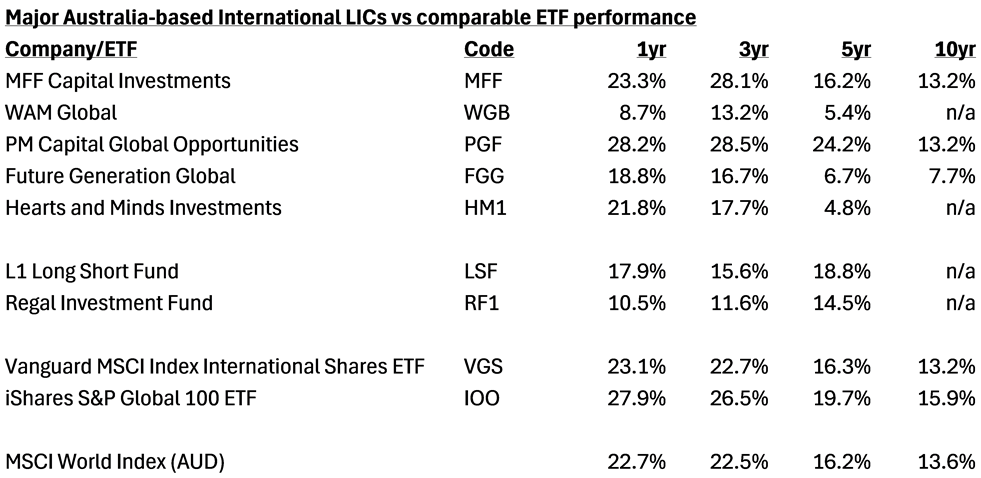
Note: LIC performance is pretax NTA per annum, and assumes reinvestment of net dividends, but does not incorporate franking. ETFs are post fees, pre-tax. The performance figures are through to end Sept. Source: Bell Potter
The hit rate for international LICs is better. PM Capital Global Opportunities and MFF Capital have both outperformed over one and three years. However, both have trailed the index over 10 years.
PM Capital has performed well given it’s a value-cased investor in a world where value stocks have been decimated by growth stocks since the GFC. Their bets on European banks have paid off in recent years (yes, European banks – the dogs of yesteryear – have bounced hard).
MFF is a quality/growth investor and principally holds household stocks in the US, such as Visa, Mastercard, American Express, Amazon, and Bank of America. It’s run by the highly regarded Chris MacKay.
WAM Global, Future Generations Global, and Hearts and Minds Investments have been poor investments over all time periods.
Of the alternative category of international equity LICs, L1 has underperformed of late, but has a better long-term track record.
Let’s turn to how the international LIC share prices have done.
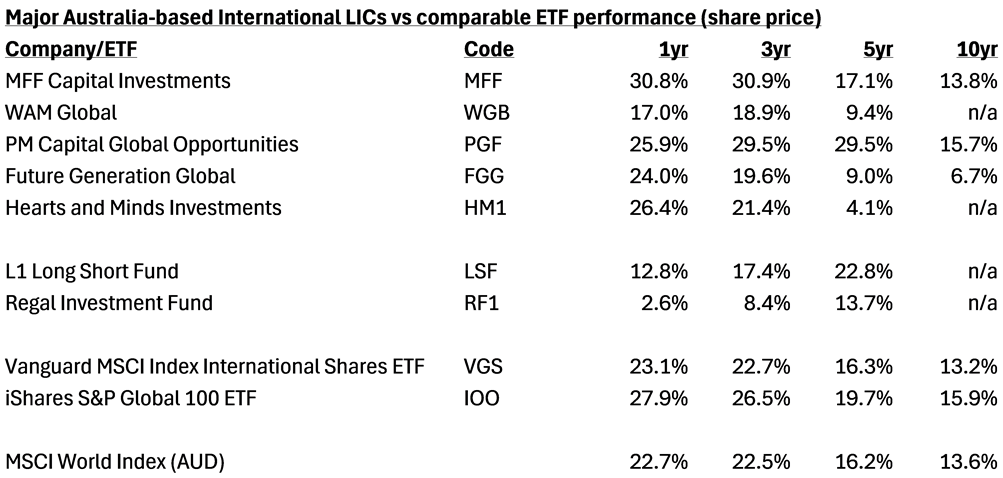
Note: The performance figures are through to end Sept. Source: Bell Potter
This table tells a different tale. The narrowing of NAV discounts has led to four out of the five LICs outperforming over the past 12 months. That whittles down to two outperforming over five and ten years.
The other striking feature of the above table is how the top 100 global stocks have performed via iShares S&P Global 100 ETF. That’s largely been driven by the staggering returns of the ‘Magnificent Seven’.
Management fees
No article on LICs and ETFs would be complete without mentioning fees.
Below are the management expense ratios for the major Australian and international equity LICs versus the costs of comparable ETFs.
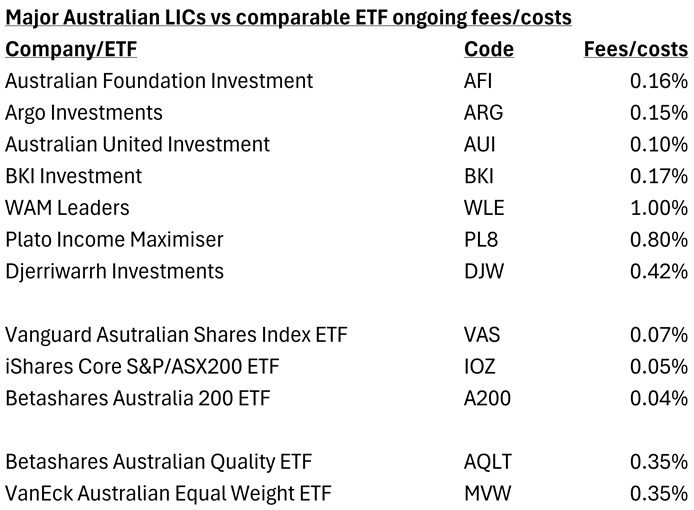
Source: Independent Investment Research, company websites

Source: Independent Investment Research, company websites
For LICs, operational expenses like management and performance fees are subtracted from the total assets, reducing the final NTA value per share.
*Full disclosure: Vanguard and VanEck are Firstlinks sponsors.
James Gruber is Editor of Firstlinks.