Register For Our Mailing List

Register to receive our free weekly newsletter including editorials.

Home / 640

Solving the Australian equities conundrum

The performance of the Australian equities market this year has highlighted, once again, a persistent conundrum facing investors – how to approach a heavily concentrated index reliant on two sectors and a handful of stocks.

The biggest driver of the S&P/ASX 200 on the way up to the record high on October 21, and the retracement since, has been the performance of some of the biggest companies in the index. These are the cornerstones of many portfolios – the likes of CBA, Westpac, ANZ, NAB, CSL, Telstra and Wesfarmers.

As these household names are all terrific businesses admired for delivering for investors over a long period, many people are content to leave them in the bottom drawer – particularly the banks, as a source of much-loved fully-franked dividends.

In the meantime, however, share prices for these mature businesses can run well beyond their fundamental values (see my previous article on the importance of systematic rebalancing). CBA is one of the most expensive banks in the world. It doesn’t take much bad news for performance to turn around and for the portfolio to go with it.  Those with overweight positions in CBA and CSL can attest to this phenomenon in the last few months.

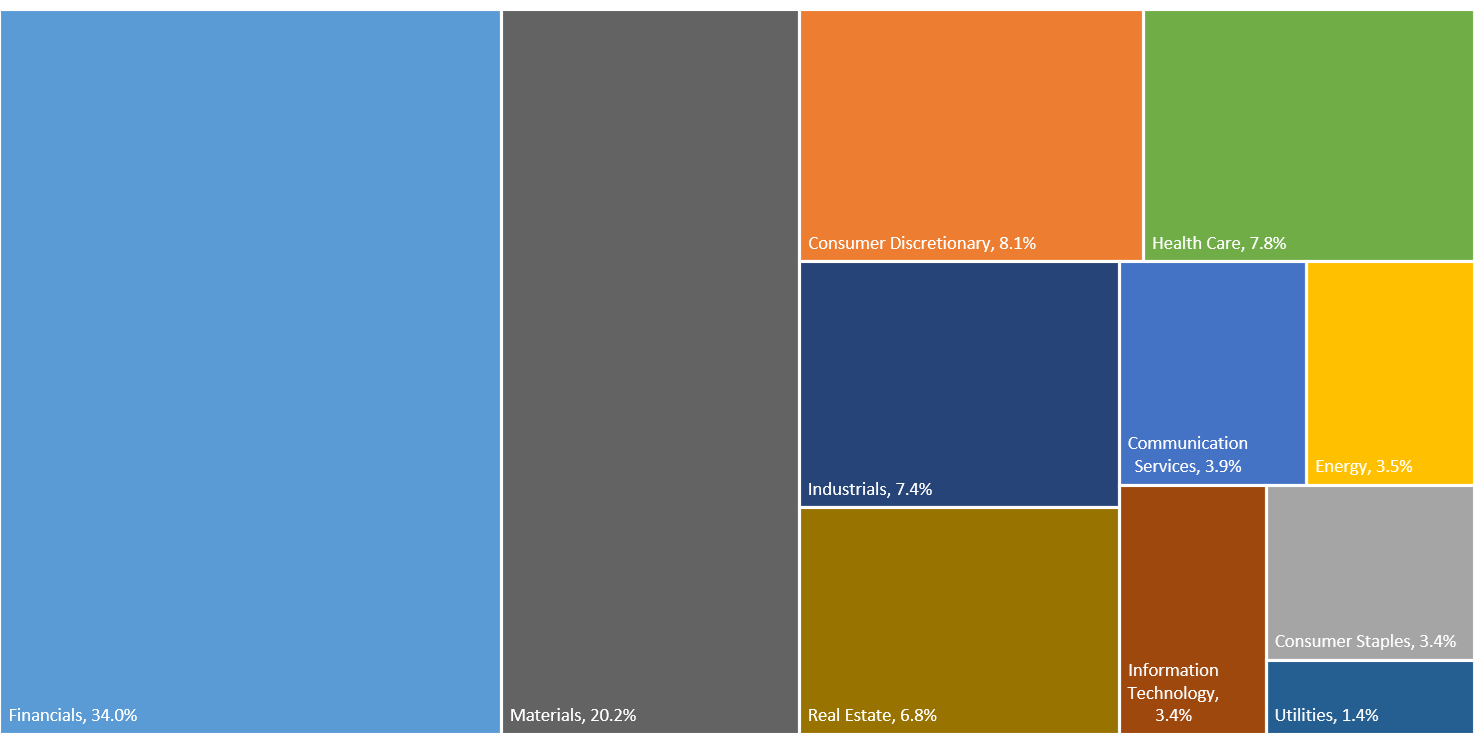
Equally, those taking a passive, market index approach are experiencing a similar conundrum. Of the S&P/ASX 200 index, 54% is made up of banks and miners. The recent strong performance of the banks has lifted the financials weighting to more than a third. Just 10 companies account for almost half of the index value. And CBA alone accounts for almost 10% of the index.

Composition of the S&P/ASX 200 by industry sector weight as at 30 September 2025
Source: Minchin Moore Private Wealth.

Looking to the future

Saying these household name companies have delivered up till now is all very well, but investing is about the future. And in a market so top-heavy, it is worth asking whether such mature businesses - with potential headwinds in excessive valuations, cyclicality and slowing relative growth in earnings - will continue to do so.

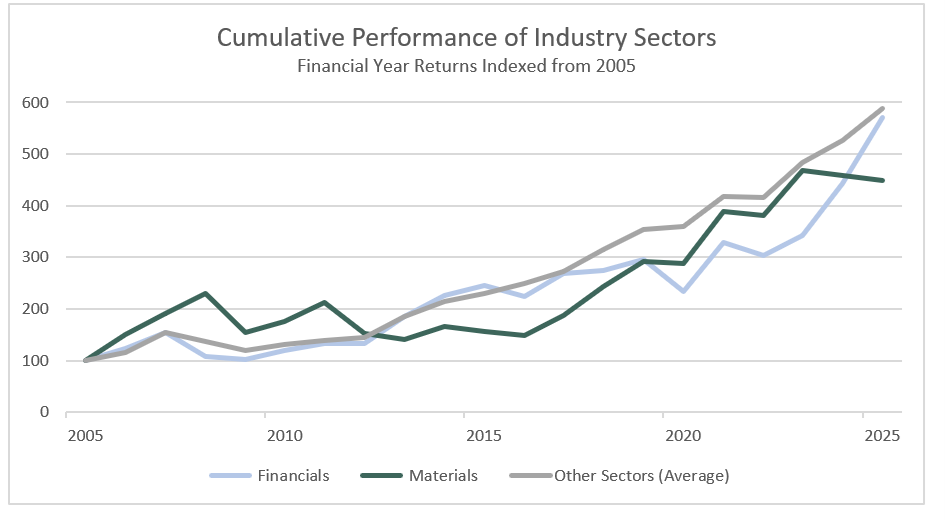
Indeed, the chart below shows that both Materials and Financials over the last 20 years have underperformed relative to other sectors in the Australian market. Furthermore, those two sectors have been more volatile, and each have had long periods of underperformance.

Source: Minchin Moore Private Wealth.

What’s more, we know that the make-up of the local market is as challenging for professional investors as it is for the self-directed investor.

For instance, evidence shows most actively managed 'stock picking' managers in Australian large caps underperform the benchmark after costs over the medium to longer term.

So the question becomes if the index is too reliant on two sectors and active stock-picking has proven to be so difficult, how do we address these challenges?

Rethinking the core portfolio

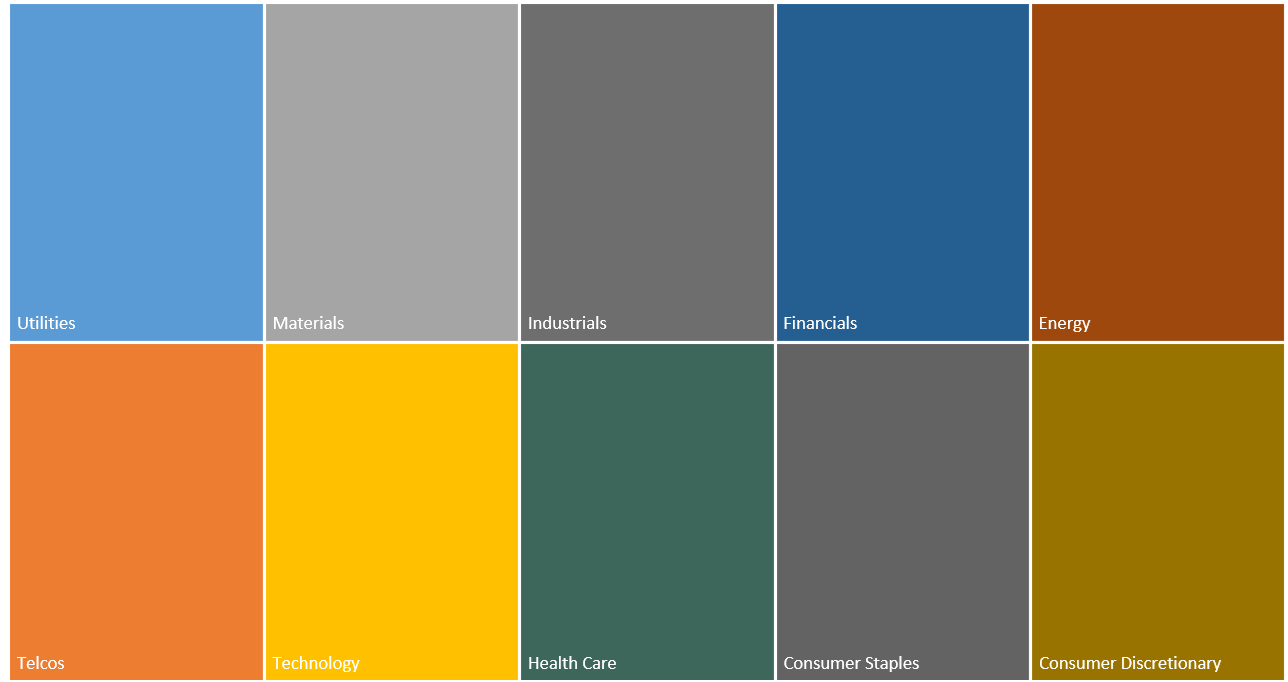
One idea is to take a more diversified approach to large cap equities by equally weighting exposure to industry sectors – 10% in each of the 10 industry sectors (excluding property given it is treated as a discrete asset class).  

This can be implemented in a systematic, rules-based approach coupled with periodic rebalancing. Not required here is active stock picking, forecasting, valuation models, or second-guessing constituents. Instead, we can stick to an index-style mandate and a set of rules regardless of market sentiment.

Equal-weight investing has consistently shown evidence of enhanced long-term returns and diversification benefits compared with traditional cap-weighted approaches. Academic and practitioner studies have found that equal-weight portfolios tend to outperform over time due to a systematic “rebalancing premium”. This contrarian effect captures mean reversion and maintains balanced exposure across all constituents rather than concentrating exposures in the largest companies and sectors. Evidence suggests equal weighting reduces concentration risk, improving portfolio resilience when dominant mega-cap stocks and sectors underperform.

Source: Minchin Moore Private Wealth.

There are not only substantial diversification benefits from holding a higher exposure to the often-neglected smaller industry sectors, but also return opportunities across the cycle.

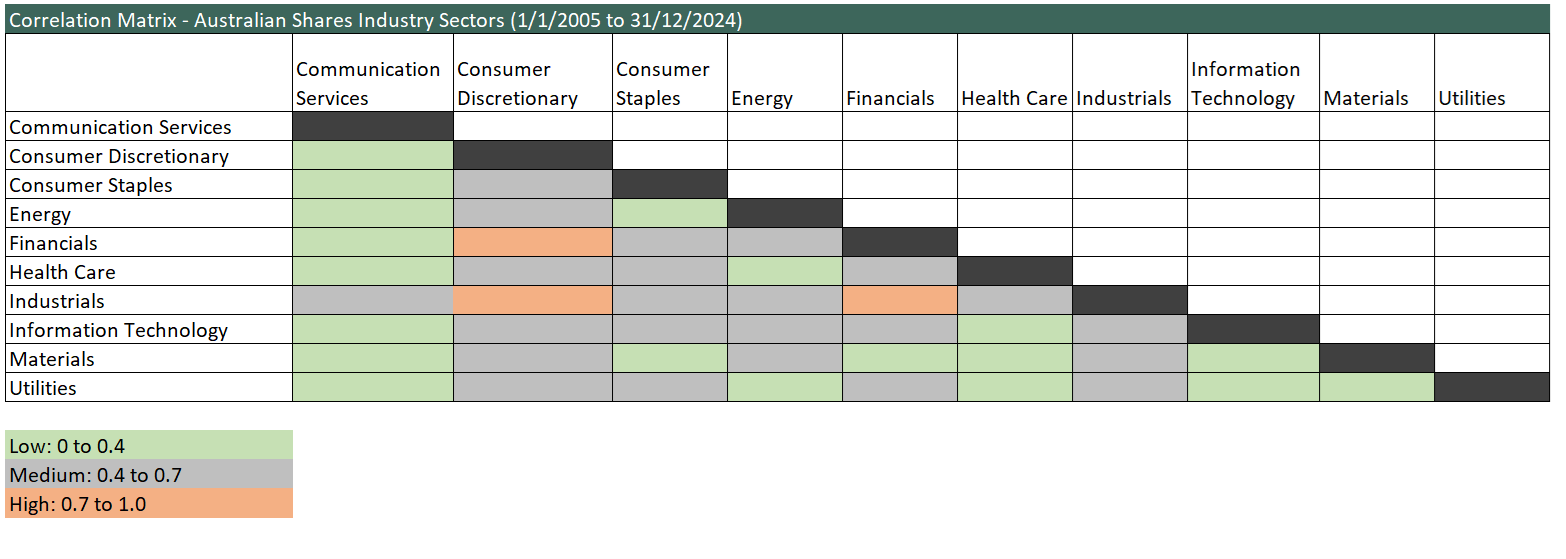
On the diversification front, the matrix below highlights the low correlation between sectors, which can optimise the risk/return characteristics of the portfolio.

Source: Minchin Moore Private Wealth.

From the performance perspective, sector leaders and laggards often rotate from year to year as market and economic conditions support or detract from the performance.

A good example is 2022. The Ukraine war had broken out, oil prices spiked and energy stocks outperformed. At the same time, the surge in inflation and subsequent increase in interest rates after COVID impacted adversely on long-duration, technology stocks. In the subsequent years, however, the relative performance of these two sectors reversed.

This is the benefit of a systematic approach of rebalancing back to sector and stock weights. Positions in outperformers are trimmed to reinvest in the laggards. But this is done in a disciplined way that effectively means selling high and buying low, thus enhancing portfolio returns.
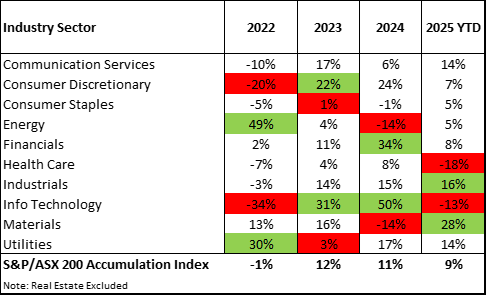

Source: Minchin Moore Private Wealth. Calendar year returns and 2025 year to date to 30 November

The outcome of this approach is a core Australian equity portfolio which over the long-term has:

  • Lower volatility than the market index
  • A higher Sharpe ratio than the index
  • Significant active sector positioning
  • Higher exposure to smaller companies than the market-weighted portfolio
  • And an increased “growth” bias than the index.

Adding another layer

In addition to rethinking the construction of the core, large cap portfolio, the Australian equity sleeve can be optimised further by introducing value and size “factors”, for which there is strong academic evidence of a long-term premium.

Value captures the positive link between stocks that have low prices relative to fundamental values. Size captures the excess returns of smaller firms (by market capitalisation) relative to their larger counterparts, even after adjusting for betas and other factors like value, momentum, and liquidity.

Combining these factor exposures with the core large companies holding leads to a well-diversified aggregate Australian equity exposure consisting of:

  • Large Companies (for broad market exposure),
  • Value Companies (those with cheaper relative valuations), and
  • Mid/Small Companies (expected to deliver higher returns over time).

Each of these constituents behave differently across time, and each plays a role in contributing to performance and risk management.

Through the investment cycle we expect each to experience different sequencing of return, leading to opportunities to top up the underperforming components and take profits from the components that are performing well.

Solving the conundrum

The Australian market, as we have seen, is concentrated in a couple of sectors and a handful of names, posting thorny challenges for both self-directed and professional investors.

One answer, as we have shown here, is to set up a durable portfolio and process that is not overly reliant on one or two sectors or a bunch of household names.

Over time, structure and discipline will prove to be more reliable features of your investing toolkit than research-based forecasts or poring over the daily financial news.

By attending to diversification, disciplined rebalancing and long-term value and size factors, we can build a sustainable and methodical portfolio that focuses on variables within our control and gives us the best chance of meeting our objectives.


Jamie Wickham, CFA is a Partner at Minchin Moore Private Wealth and former managing director, Morningstar Australia.


  •   3 December 2025
  • 9
  •      
  •   
9 Comments
Michael Cunningham
December 04, 2025

Great article. For those who like ETFs a simple entry point for equal weight investing could be VanEck's MVW. Thoughts?

7
Edward
December 04, 2025

Agree with Stephen F that equal weighting only leads to marginally better results. Look at midcap ETF and its a whole different story: significant outperformance over both medium and long term.

4
Stephen F
December 04, 2025

An interesting idea and worthwhile pursuing but there is scope for a follow up as the article leaves out the most important fact - what is the performance of the equally weighted portfolio? I have backtested the idea of buying the top 200 stocks equally weighted over the last 26 years and the result is 9.3% pa vs 8.7% pa for the All Ords Accumulation Index. That is not much difference for a whole lot of extra work and extra trading, which could eliminate the difference in slippage and brokerage. That is different from equally weighted sectors. How would you implement equally weighted sectors? I suppose you could take stocks in the top 200 and equally weight the sectors. Let's say we set up a $1 million portfolio. The author eliminates real estate as a sector but real estate is included in the ASX 200 index and S&P consider it a sector so it could be included. This means $90,900 per sector. The largest sector is financials with 32 stocks so each stock would be $2,800 including CBA. The smallest sector is utilities with 3 stocks so each stock would be $30,300 comprising Origin, APA and AGL. Is this how it would work?

3
Todd
December 05, 2025

Great article...This approach makes a lot of sense as a risk mitigation strategy.
More so in market so heavily dominated by one or two sectors...like Australia.

1
Charles A
December 04, 2025

S&P/ASX Small Ordinaries ETF is perhaps another way to tackle this by just chopping out the ASX 100 holdings - reduces financials to 10% although admittedly materials is still 27%. I guess you could make the argument that materials is a pretty diverse sector though ranging from gold to lithium to iron ore and that over time you get smaller companies outperformance.

Peter
December 09, 2025

The ASX midcap ETF MVE outperforms significantly the ASX small ords ETF MVS (10 year returns: MVE-14.44% vs MVS - 7.80%). Big difference. Putting 100,000 into each will see you in 10 years have around 400,000 with MVE and about 230,000 with MVS.

https://www.vaneck.com.au/etf/equity/mve/performance/
https://www.vaneck.com.au/etf/equity/mvs/performance/

Nadal House
December 04, 2025

Transaction costs and tax can be a drag on returns with a systematic rebalancing strategy. The question for Minchin Moore is how much of a drag?

Peter
December 09, 2025

The ASX Equal Weight ETF MVW has returned 9.90% over the last 10 years. Over the same time period the ASX midcap ETF MVE has returned 14.44% and the ASX small ords ETF MVS has returned 7.80%. I think I know why the midcap ETF has better returns but that is not that important. What is important are the returns. Putting 100,000 into each 10 years ago would have resulted in you having now about 240,000 in MVW, 340,000 in MVE and 197,000 in MVS. Big differences which could make a big difference to a person at retirement.

https://www.vaneck.com.au/etf/equity/mvw/performance/
https://www.vaneck.com.au/etf/equity/mve/performance/
https://www.vaneck.com.au/etf/equity/mvs/performance/


Leave a Comment:

RELATED ARTICLES

With markets near record highs, here's what you should do with your portfolio

The new capital gains tax trap for your portfolio

Here’s my investment philosophy. What’s yours?

banner

Most viewed in recent weeks

Why spending more in early retirement can improve lifetime income

Conventional wisdom encourages retirees to preserve superannuation. But if those likely to qualify for the Age Pension later in life spend a little more today, it may deliver higher lifetime income and a more stable retirement.

It’s time for LICs to die

A high-profile dividend cut and a prominent fund manager’s apology have reignited a long-running debate. If investors can access similar exposures more cheaply and efficiently elsewhere, what exactly is keeping LICs alive?

Testamentary trusts survived the trust tax. The drafting battle has just begun.

The fight over testamentary trusts looked settled. Then the draft legislation arrived. Hidden in a technical detail is a question that could force many families to rethink wills they thought were already future-proof.

Is it time to bail on Australian stocks?

For generations, Australian investors have backed banks, miners and dividends. But has that loyalty come at a cost? A look at the numbers raises an uncomfortable question about where future returns will come from.

The new capital gains tax trap for your portfolio

Investors have long accepted one portfolio rule without much question. A major tax shift could change that calculation entirely, forcing difficult trade-offs between risk, discipline and an overlooked cost lurking beneath.

How the typical Australian Family could save $844,350 in taxes

The value of a testamentary trust is not determined by wealth alone. Depending on circumstances, it can reduce the tax burden on inherited income, create efficiencies and help build intergenerational wealth.

Latest Updates

Fixed interest

Higher yields are creating opportunities in global bonds

Bond markets are adjusting to a new reality, but not in the ways investors expect. With markets repricing and capital competing for attention, investors may need to rethink where resilience and opportunity lie. 

Economy

Are we in a recession?

What if the warning signs are already everywhere? From supermarket aisles to company failures, investors are being bombarded with recession signals. But most face a different risk that can be just as dangerous for portfolios. 

SMSF strategies

Meg on SMSFs - Division 296 actuarial certificates

The tax bill might be yours, but the event that caused it may not be. A key Division 296 calculation can sometimes attribute earnings in ways that many SMSF trustees won't instinctively expect or fully appreciate.

Property

The first impact of negative gearing reform is not the tax bill

Negative gearing changes formally begin in 2027, but the first consequences may already be here. A subtle shift is quietly influencing who can borrow, how much they can access and which property strategies still stack up.

Economy

The oil market is running out of easy answers

The biggest threat to markets may not be what investors are watching. The numbers have stopped adding up and supply is harder to measure, with forecasts becoming simple guesses. A more fragile reality is being masked.

Investment strategies

The state of investor knowledge in Australia

Australians are investing more than ever, yet a surprising divide is emerging between those building wealth effectively and those making costly mistakes. Surprisingly, the gap has little to do with income, age or starting capital.

Taxation

Complexity and capital gains

A case study shows that the ‘30% minimum CGT’ is a poorly conceived tax that adds significant complexity to an already over-complex system. A less complicated model would create a much fairer progressive tax scale.

Sponsors

Alliances

  • ASA-Logo-RGB-ActiveGreen-web.png

© 2026 Morningstar, Inc. All rights reserved.

Disclaimer
The data, research and opinions provided here are for information purposes; are not an offer to buy or sell a security; and are not warranted to be correct, complete or accurate. Morningstar, its affiliates, and third-party content providers are not responsible for any investment decisions, damages or losses resulting from, or related to, the data and analyses or their use. To the extent any content is general advice, it has been prepared for clients of Morningstar Australasia Pty Ltd (ABN: 95 090 665 544, AFSL: 240892), without reference to your financial objectives, situation or needs. For more information refer to our Financial Services Guide. You should consider the advice in light of these matters and if applicable, the relevant Product Disclosure Statement before making any decision to invest. Past performance does not necessarily indicate a financial product’s future performance. To obtain advice tailored to your situation, contact a professional financial adviser. Articles are current as at date of publication.
This website contains information and opinions provided by third parties. Inclusion of this information does not necessarily represent Morningstar’s positions, strategies or opinions and should not be considered an endorsement by Morningstar.