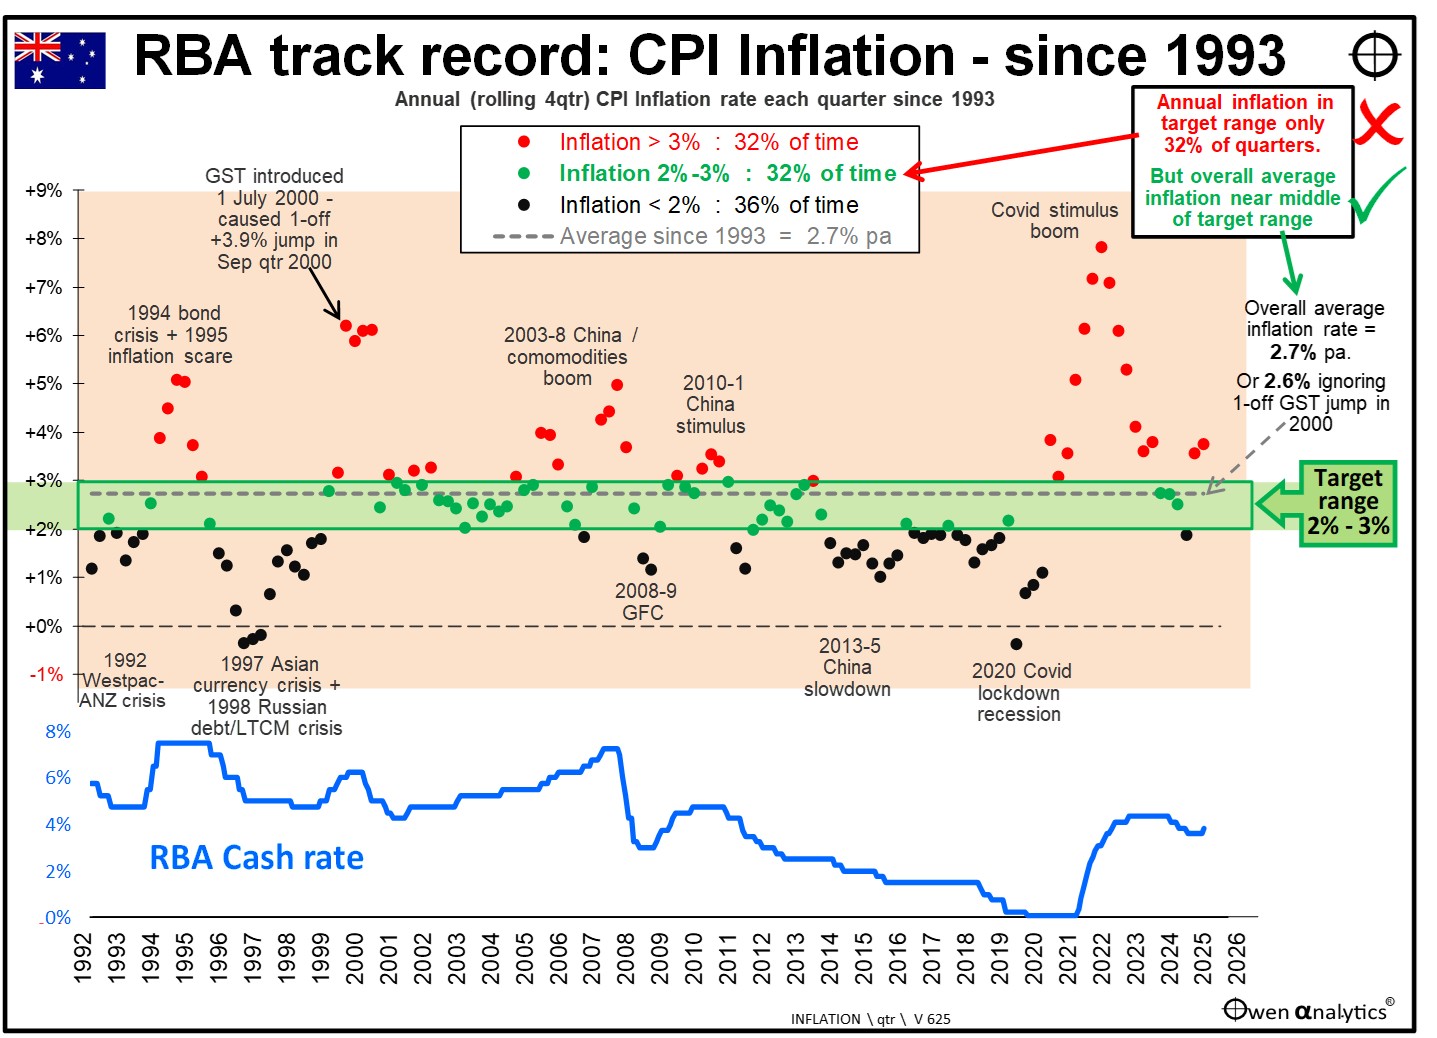
This chart shows the inflation and policy cash rate picture in Australia from 1993. The dots in the upper section represent annual (rolling four-quarter) CPI inflation each quarter (as quarterly has been the main reporting interval for inflation in Australia).
Click to enlarge
Red dots for inflation above 3%; black dots for inflation below 2%; and green dots for inflation within target 2% to 3% range
Inflation has ranged widely from a high of 7.8% in December 2022 (Covid stimulus boom) to several quarters of negative inflation during the 1997 Asian currency crisis, 1998 Russian debt crisis, as well as 2020 Covid lockdown recession.
The green 2-3% target inflation range through the middle of the spray of inflation dots scattered by a host of global and local macro shocks illustrates how tough it has been to hit a narrow target range.
The lower section of the chart shows the RBA’s policy cash rate over the period.
One adjustment - for GST introduction
Just one mechanical note. The 10% Goods and Services Tax was introduced from 1 July 2000 caused a one-off +3.9% jump in the general price index in the September quarter 2000. It also affected the rolling four-quarter annual inflation rates in the subsequent three quarters. We can see these four quarterly red dots in 2000-1 on the chart.
A step change in the general price index due to a one-off tax change is not ‘inflation’, so I adjust for this in measuring average inflation rates.
Brief history of RBA independence and inflation targeting
The Reserve Bank of Australia was established in 1960 (It essentially split out the central banking functions from the government-owned Commonwealth Bank which had been set up in 1911 under the Andrew Fisher Labor government with the intended aim of taking over and eliminating all existing commercial banks, to become one giant, universal, monopoly government-owned peoples’ bank).
The newly formed RBA had three legislated goals set out in section 10(2) of the original Reserve Bank Act 1959:
- “the stability of the currency of Australia;
- the maintenance of full employment in Australia; and
- the economic prosperity and welfare of the people of Australia.”
These goals remain to this day. Although the Reserve Bank Act has been amended several times since 1959, the three original paramount goals are preserved in sections 9B(1)(a)(i), 9B(1)(a)(ii), and 8AA(1) of the current (2025) legislation.
Looking at each of these RBA goals:
Goal 1: ‘Stability of the currency’
This currency stability goal is essentially the RBA’s inflation goal, which is the subject of this report. I outline below how the inflation target evolved for the RBA, and how its ability to ‘independently’ pursue this goal evolved. More on these later.
Goal 2: ‘Full employment’
The idea of twin goals of inflation and unemployment was based on the Keynesian notion, prevalent from the mid-1930s to the early 1970s, that there was a policy trade-off between inflation and unemployment. This broke down in the ‘stagflation’ of the 1970s when both inflation and unemployment ran at high levels simultaneously, and it became clear to all (except Kaleckian-Marxists) that a new policy framework was needed.
‘Full employment’ does not mean zero unemployment. Full employment allows for a small level of unemployment in the economy, so that tight labour markets do not fuel excess wage claims and inflation. There is a level of unemployment below which it becomes inflationary. This optimal level of unemployment is known as ‘NAIRU’ (non-accelerating inflation rate of unemployment).
One major problem is that optimal ‘NAIRU’ unemployment is not a constant number. In Australia, NAIRU (ie lowest non-inflationary unemployment rate) was around 2% in the 1960s, then rose to around 7% in the mid-1970s, but came back down to around 6% by the late 1990s.
When current RBA governor Michelle Bullock commenced her term in 2023, she estimated full employment NAIRU as an unemployment rate of around 4.5% - ie inflation below 4.5% was likely to cause inflationary wage pressures.
Since RBA ‘independence’ in the early-mid-1990s (which I cover below), the unemployment rate has averaged 6.0%, which is about 1% above the estimated average optimal NAIRU rate over the period.
We cannot blame the RBA for that as there has been a general consensus since the mid-1970s that the ‘Phillips Curve’ trade-off between inflation and unemployment does not work, so the RBA cannot be held accountable for higher than desired unemployment that may or may not have resulted from the RBA’s inflation targeting and inflation outcomes.
Goal 3: ‘Economic prosperity and welfare’
This is a catch-all, over-arching provision intended to guide the RBA in its conduct of monetary policy. It goes beyond the specific inflation and full employment goals, and extends to other policy areas including financial stability, payments systems, and also originally included the prudential regulation of financial institutions (this was shifted from the RBA to APRA in 1998).
There are frequent debates in central banking circles about whether the overall ‘prosperity and welfare’ goal should extend to things like financial market bubbles (perhaps), and to housing (probably should, given the large impact of housing affordability and housing debt on overall economic activity in Australia). (Just my personal views there.)
Inflation targeting and RBA ‘independence’ in Australia
During the first three decades of its operation, the RBA was not free to formulate and execute monetary policy (or exchange rate policy or bank policy, etc) in its own right. It was essentially an adviser to government, and implementer of monetary policies set by the Treasurer and/or Treasury.
The problem was that in these three decades from 1960 to 1990, CPI inflation in Australia averaged a rather high 6.9% per year (including averaging 10.1% in the 1970s, and 8.3% in the 1980s).
The failure of governments to control inflation in the 1970s (not just in Australia but around the world) resulted in governments finally admitting defeat, letting go the reins, and allowing their central banks to manage monetary policy, away from the grubby hands of governments. Australia was a decade late on this, as we see below.
As economist David Riccardo (architect of the ‘Ricardian theory of free trade’, and the notion of ‘comparative advantage’ of nations) had warned in the 1820s, governments should not be safely entrusted with the power of issuing paper money as they would most certainly abuse it. (‘Plan for the Establishment of a National Bank’, published posthumously in 1824.)
How has the RBA done?
Taken from 1993 as the start of RBA targeting a 2-3% inflation range with substantive policy and operational independence (although you could use 1994 or 1995 or 1996 with the same results), and adjusting for the one-off GST impact in 2000 (as it was not ‘inflation’ but a one-off tax change) we get the following inflation results for the RBA:
Annual inflation outcomes per quarter and per year
Annual (ie rolling four-quarter) inflation has only been within the 2-3% target range just 32% of quarters, and just 36% of calendar years. So the RBA scores just 3 out of 10 for short-term inflation targeting. A quick look at the chart shows only around one third of the dots are in the target (green) range.
However, that is actually not bad given the enormity and impacts of the global macro challenges faced by central bankers over the past 30+years.
Decade averages
Quarterly and yearly inflation measures are rather harsh tests given the volatile nature of inflation components and the data lags involved - from measurement, reporting, decisions, and impacts.
Therefore if we view inflation outcomes decade by decade, inflation has been within the target range each decade:
- Inflation averaged 2.3% pa in the 1990s,
- 2.8% pa in the 2000s,
- 2.1% pa in the 2010s.
- So far in the 2020s inflation has averaged 3.8% pa to date. This above target but we have some years left to run for this decade, so it is too early to call.
- However, for the 10 years to December 2025, inflation averaged 3.0%, which is just inside the target range.
- Therefore the RBA gets full marks on decade average inflation outcomes.
Overall inflation experience
Overall inflation over the whole period has averaged 2.6% per year (or 2.7% pa if you don’t adjust for the one-off GST jump in 2000). This is in the middle of target inflation range – so the RBA scores 10 out of 10 for long-term inflation targeting.
Ashley Owen, CFA is Founder and Principal of OwenAnalytics. Ashley is a well-known Australian market commentator with over 40 years’ experience. This article is for general information purposes only and does not consider the circumstances of any individual. You can subscribe to OwenAnalytics Newsletter here.