The Reserve Bank of Australia (RBA) announced a surprise adjustment to its policy path when it reduced the pace of tightening to 0.25% after months of 0.5% increases. We applaud the RBA for moderating its pace as it should minimise the chance of over-tightening and a potential accident. Lags between policy changes and impact are approximately three months on average and the RBA increasingly acknowledges that most borrowers have still only experienced the first handful of rate hikes.
Monetary policy has reached a critical point
This new pace of rate increases represents an important stage in the tightening cycle. The RBA estimates the neutral policy setting for the Australian economy is circa 2.50%. Hence, any additional increase in the cash rate above 2.50% represents an ever-greater level of intensity applied to the economic brakes. It appears Australia is now entering the late stages of the tightening cycle.
The forward-looking market impact from October’s RBA policy announcement was immediate. Prior to the RBA meeting, market pricing had the terminal cash rate in Australia circa 4.35%. This quickly came down 0.50% to 3.85%, validating our view that market expectations for policy in Australia have been too aggressive. At 3.85%, we believe market pricing remains aggressive relative to where the RBA is likely to pause.
Where to from here?
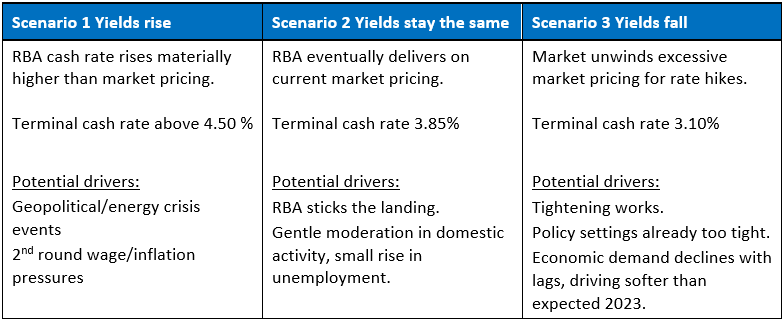
At the risk of over-simplifying, in fixed income, there are three broad scenarios:
- Yields rise
- Yields stay the same (track sideways in a range)
- Yields fall
What is less widely-understood is the consequences of the market already building these scenarios into existing interest rates.
Scenario 1 (yields rise) has been the experience for much of the last 12 months as markets adjusted to higher interest rates, driving negative bond returns. The chart below shows the path of the actual cash rate from 0.1% in May 2022 to the current 2.60% in October. The chart also shows that the market has already priced (projected) the cash rate will rise to 3.85% next year.
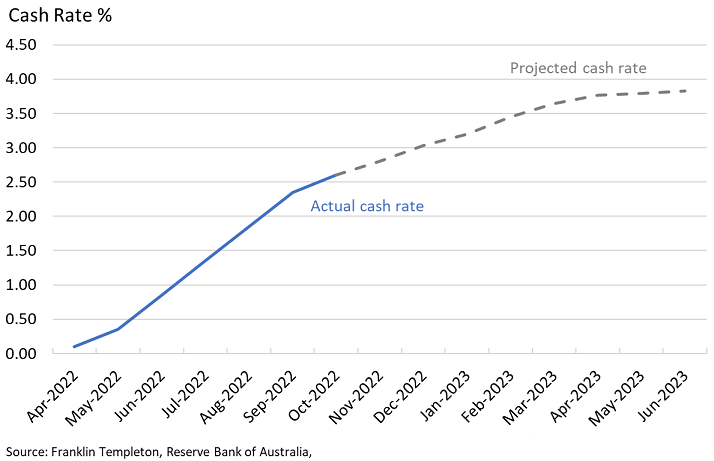
Both components – i.e. the change in actual cash rate and the market projected cash rate – are already ‘in the price’. So, for scenario 1 to have a meaningful return impact over the next 6-12 months, the market will need to be concerned that the actual cash rate will rise above market projections, above 4.0%. The tone and actions of the RBA in this past week suggest this is now a low probability scenario.
Scenario 2 (yields stay the same, track sideways in a range), suggests that with time the market projections in the above chart will be broadly met and no material adjustment in yields (higher or lower) is likely. Under this scenario, the portfolio effectively earns its yield over the next 12 months.
Our core view is that current market pricing for the terminal cash rate remains too high. We believe the actual cash cate will settle at 3.10% and scenario 3 (yields fall) is most likely over the next 6-12 months.
Tightening works
Monetary policy works with a lag and the strident leaps the RBA has taken in recent months won’t show up in behaviour and key data until the few remaining months of this year. But show up they will and that is before any further tightening that will ensure 2023 will be truly a challenging year.
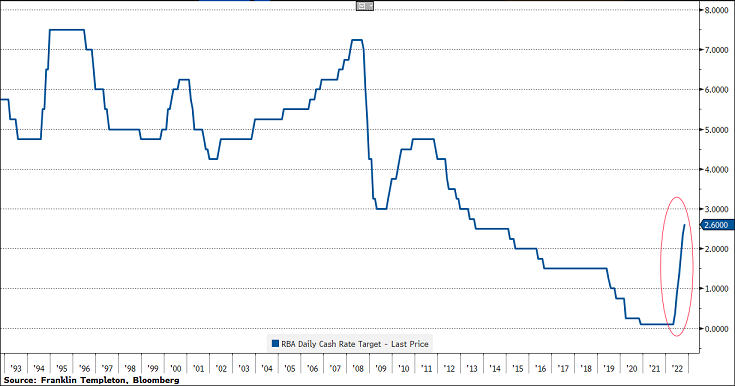
The chart below shows policy settings over the last 30 years and illustrates how sharp the current adjustment has been. The full impact of tightening has not yet been felt in the economy. It’s a bit like having six shots of vodka and suddenly you realise that you’ve drunk too much!
Some indications the worst is in the past
Our economic indicators show that momentum has turned down significantly across several indicators: namely, consumer confidence, housing (cash flows, prices, construction approvals, work done and construction materials prices), financial conditions, and trading partner growth.
Global pressures behind high inflation this year also appear to be through the worst. Global supply chains are flowing more freely with shipping costs retracing significantly lower. Commodity prices are down, and inflation expectations are contained across consumers and financial markets.
On the strong side, business sentiment remains elevated, and the labour market is tight with jobs for anyone who wants one. In fact, this is arguably the tightest labour market we have seen in 50+ years. This has translated into wages growth from the Covid lows up 2.6% so far. Looking forward, partial indicators suggest further wage increases up to the 3.50-3.75% area next year.
But, by 2H2023, labour supply will have improved substantially through an accelerated net migration program. Preliminary signs of a slowdown in job vacancies, albeit from elevated levels, are also emerging. This coincides with the lags in central bank policy, ultimately driving diminishing domestic demand from the RBA’s tightening this year, including what’s still to come.
Modelling our core view suggests that the term yields will adjust materially lower. Initially, we estimate bonds to rally in the order of 0.5%-0.75% as the excessive tightening priced in the market is unwound. The market will then take several months to assess the underlying economy after which we expect a second rally as the market begins to price for subsequent policy easing by late 2023, early 2024.
In sum, what makes bonds beautiful is the favourable skew in return outcomes under various scenarios. We believe fixed income investment is supported by either scenario 2 (yields stay the same), or scenario 3 (yields fall). Today, we believe probabilities are skewed to these scenarios.
Chris Siniakov is Managing Director, Fixed Income at Franklin Templeton, a sponsor of Firstlinks. This article is for information purposes only and does not constitute investment or financial product advice. It does not consider the individual circumstances, objectives, financial situation, or needs of any individual.
For more articles and papers from Franklin Templeton and specialist investment managers, please click here.