If asked to identify a stock that has achieved over a 500% total return, compounded earnings at an annualized growth rate of 10% or greater, traded at an earnings multiple of less than 15x, and maintained or raised its dividend for over 20 consecutive years, what names come to mind?
If you answered Microsoft, Apple, Alphabet, or Nvidia, you would only be partially correct. While each of these gilded tech names met at least one of those criteria, none satisfied all four metrics at the same time.
The companies that did were relatively boring, unglamorous staples and insurance names, like Kroger and Allstate. These businesses were not only durable in difficult markets but compounded through them, generating outstanding long-term returns for some investors while others seemed distracted by the market’s loudest theme.
Today, that distraction is AI. When one narrative becomes the market’s primary engine—with headlines, capital flows, valuations, and index weights all pointing in the same direction—we have found that opportunity often builds quietly where most investors are ignoring. Today, we believe the classically defensive areas within developed markets not only offer the potential for steady returns but also present a true “coiled spring” setup.
An underappreciated opportunity
A broad swath of defensive stocks is currently trading near multi-decade lows on key relative measures, notably their relative forward P/E and weight in the S&P 500. Meanwhile, index concentration has surged: today roughly half of the S&P 500’s market cap is tied to AI-related exposure, and the “Mag 7” alone represent approximately 35% of the index. This rally, supercharged since ChatGPT’s release in November 2022, has reshaped the index and widened the valuation gap versus defensives to create an opportunity we rarely see.
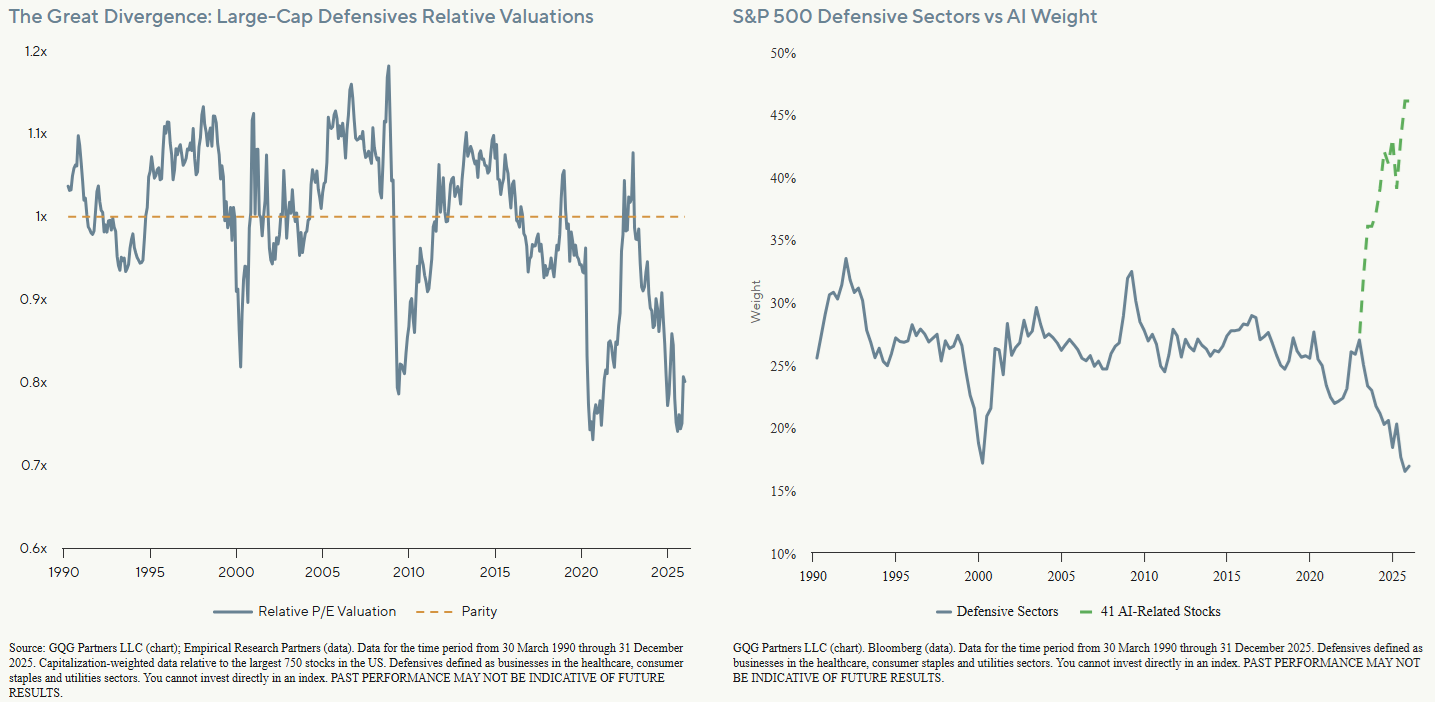
To characterize our view of a coiled spring setup, one helpful theoretical lens grounded in nearly 40 years of history is the relationship between defensives’ share of the S&P 500 and their coincident relative performance. Empirically, every 1% change in defensives’ share in the S&P 500 has tended to align with roughly 10% of relative performance. With defensives today representing about 17% of the S&P 500 versus a long-term average of 26%, that 9% gap implies a potential relative upside of 90% if the composition were to revert to the long-term average. While we do not underwrite that outcome, we view it as optionality on top of returns we believe are already achievable and attractive on fundamentals alone.
To be clear, we never buy anything on the basis of mean reversion. Our process is rooted in assessing business quality, visibility, and durability of earnings, and what we view as a reasonable path for generating high-single-digit to low-double-digit returns. That said, when gaps get this wide, we believe it is impossible to ignore that any normalization has the potential to be additive—and markets rarely normalize “politely.”
While the market is captivated by flashy technology, we are more galvanized than ever about staying true to our philosophy: high-quality businesses with durable earnings power at defensible valuations. In our view, the opportunity today is not chasing what has already been bid up, it is about owning what meets our minimum hurdle rate on fundamentals and can rebound sharply when capital rotates, concentration breaks, and valuations mean-revert. The current dispersion between defensives and the broader market does not just suggest upside; it suggests the potential for a swift, powerful snapback when the story changes, in our opinion.
Consistency beats trendy
Defensive stocks offer steady growth, high visibility, and attractive returns through dividends and buybacks, making them resilient investments often overlooked by the market.
While their growth may not match the rapid revenue or earnings expansion seen in companies like Nvidia or early-stage software businesses, it is consistent and almost formulaic. For instance, utilities like Duke Energy project long-term EPS growth of 5% to 7% through 2029 coupled with a ~4% dividend yield, delivering a total return potential of around 9% to 11% with minimal valuation risk, in our view.1
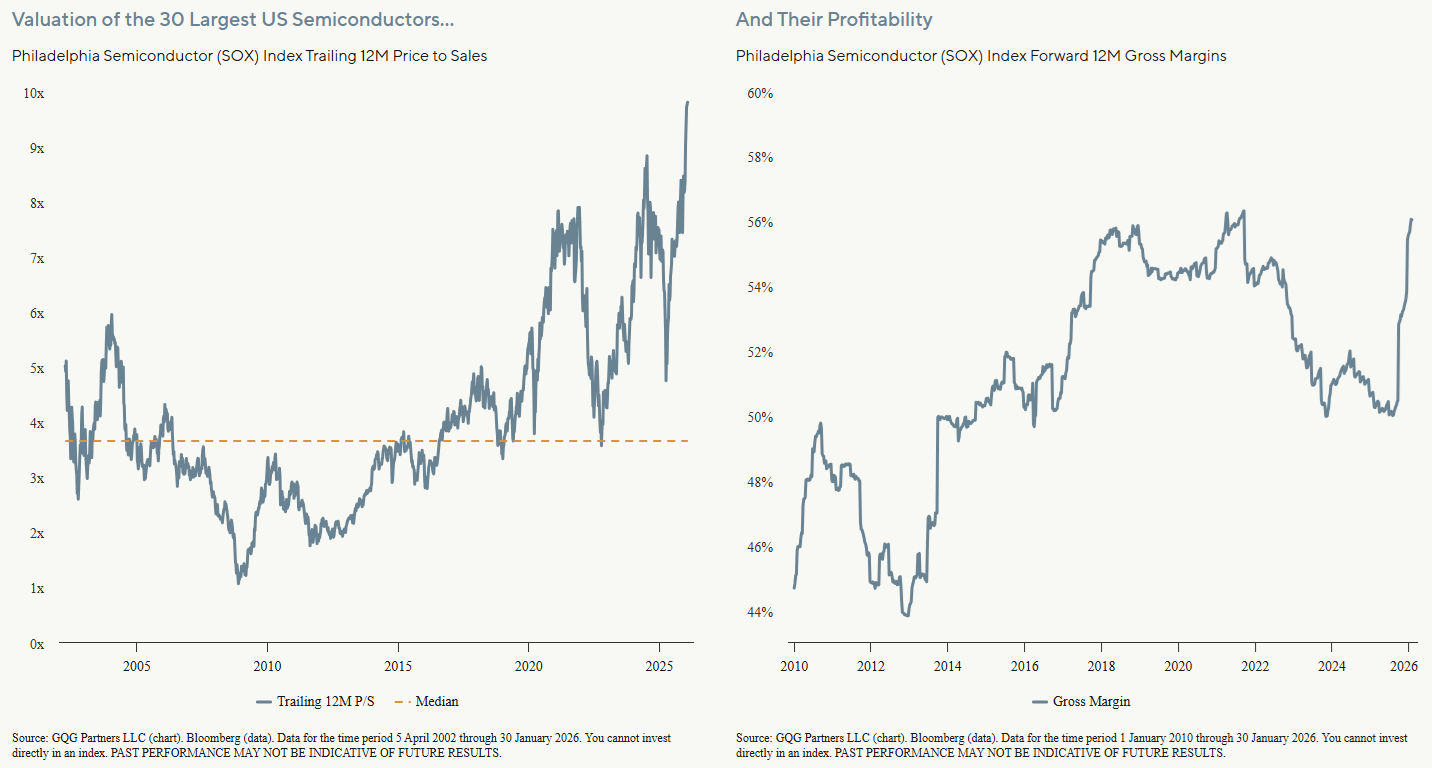
But in momentum-heavy markets, steady and visible cash flows do not capture attention the way big promises of future profitability do. This is further underscored by the fact that AI narratives have been driving the market frenzy. Semiconductors, cloud, and data center infrastructure businesses—among the most cyclical industries in the world—have become irresistible magnets for capital, as we have discussed at length in our Dotcom on Steroids series.2 Investors seem to be willfully ignoring their inherent cyclicality, chasing businesses trading at sky-high valuations on peak margins tied to AI trends with little regard for near-term profitability. Many names in these industries are now ‘priced for perfection,’ in our opinion, leaving no margin for error and setting the stage for significant disappointment when the inevitable CapEx spending slowdown arrives. We feel the disregard for these businesses’ historical boom-and-bust cycles is nothing short of reckless. But, as history shows, narrative-driven momentum can keep markets disconnected from fundamentals far longer than logic suggests, as seen in past bubbles including the dotcom era of the 1990s.
The dotcom bubble reached its height in early 2000, a time when US tech stock valuations were soaring, relying heavily on the promise of profitability rather than hard earnings. These valuations were fueled by a belief in the transformative power of the internet and favorable monetary conditions but overlooked traditional, yet frankly quite basic, fundamentals.
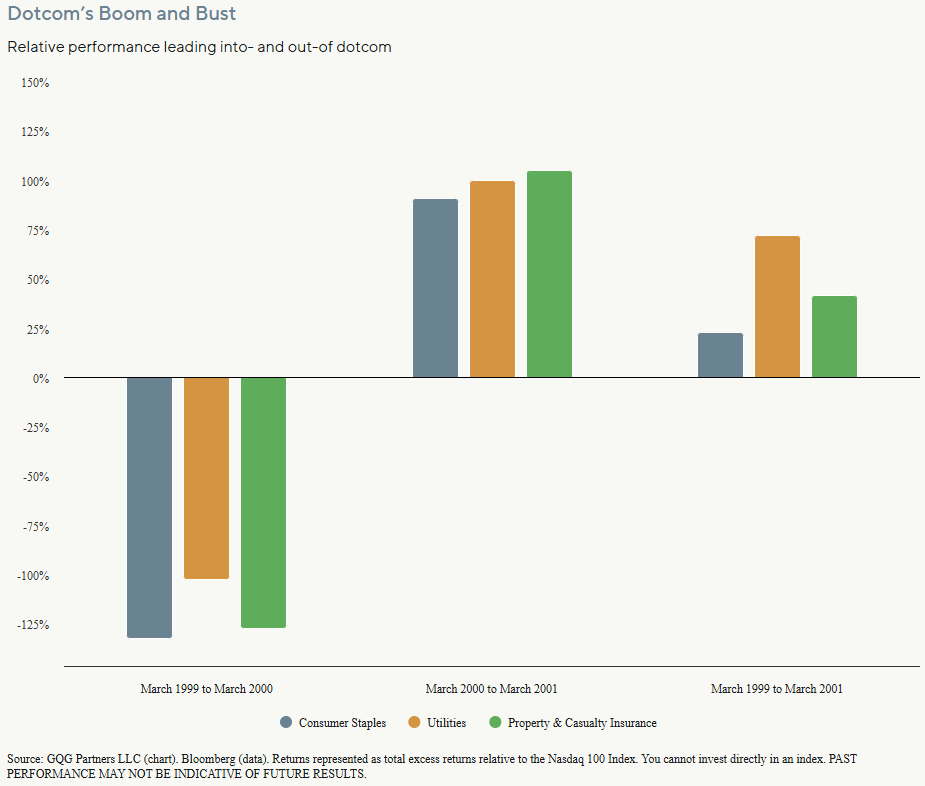
Then came the dotcom crash and bear market aftermath (March 2000 to October 2002), and that is when defensive stocks in the S&P 500 outperformed significantly, with some even gaining in absolute terms despite broader market declines.
While the S&P 500 index took around seven years to recover its peak value (until mid-2007, before another crash) and the tech-heavy Nasdaq took 15 years, defensive stocks experienced minimal losses and, as such, did not have a significant recovery period. For example, during the dotcom crash the S&P 500 plummeted 49% from peak-to-trough, but the consumer staples sector delivered 11.2% annualized returns, “a stunning outperformance of approximately 33 percentage points annually versus the broad market.”3
Companies like Procter & Gamble, Coca-Cola, and Altria Group held their stock prices while businesses tied to the internet craze imploded, with Altria surging over 100% by December 2000 from the March 2000 market peak. Utilities as a basket generated nearly 50% total returns over that same period.
History does not repeat itself, but it rhymes, and so we feel excited about the opportunity to capture outsized absolute returns within defensives given their potential of generating an asymmetric payoff if the AI bubble unwinds.
Conclusion
While the market’s center of gravity has shifted towards one story (AI), valuations and index concentration have moved with it, widening the gap between what is “exciting” and what is simply essential. That is precisely when we prefer to own businesses whose returns are driven by durable cash flows rather than perfect expectations.
Defensives today offer that setup in both the US and Europe: reasonable relative and absolute valuations, visible earnings growth, and meaningful capital return, without requiring heroic assumptions. In our view, this is a compelling paid-to-wait profile that can compound on fundamentals alone, with embedded optionality if market leadership broadens, the data center cycle normalizes, or the crowded trade unwinds. We do not buy on mean reversion, but when gaps get this wide, any normalization can become additive to already attractive expected returns.
End notes
1Duke Energy Third Quarter 2025 Earnings Report. 7 November 2025.
2GQG Research. Dotcom on Steroids Part III. 18 December 2025. Dotcom on Steroids: Part II. 21 November 2025. Dotcom on Steroids. 11 September 2025.
3”Sectors and Stocks That Gained During the Dot-Com Bust.” Red Lotus Capital. 2 November 2025.
This is an abridged extract of GQG Partners’ recent long-form article “Is Defensive the New Offensive?”. You can read the full article here. This article contains general information only, does not contain any personal advice and does not consider any prospective investor’s objectives, financial situation or needs. Before making any investment decision, you should seek expert, professional advice.