Over the past few years, commercial real estate sector returns have been dominated by the largest interest rate cycle increase in decades. The adjustment to higher rates contributed to the most significant valuation repricing since the Global Financial Crisis (GFC), as you can see in Chart 1 below.
Chart 1: Indicative market capital values and total returns across the Prime Office, Industrial & Logistics (I&L) and Sub Regional Retail sectors
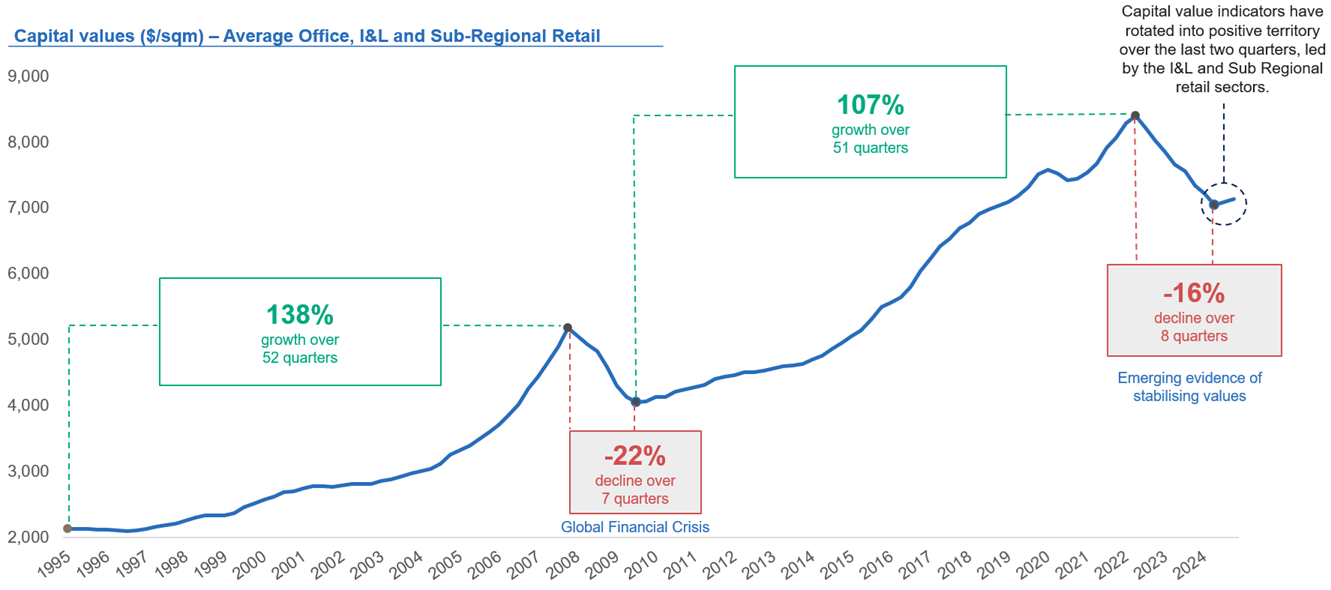
Source: JLL Research, Charter Hall Research. Click to enlarge.
Today, however, the Australian prime property sector offers compelling risk-adjusted returns. Yields are attractive compared to historical levels and offer high-quality cashflow, with forecast equity IRRs now at large premiums to bond yields. Given the gains across the broader listed equity markets over 2024, real estate sector weightings are generally below targets for institutions, increasing the prospects for material redeployment into property.
Promisingly, a recovery was sustained over the second half of 2024. Annual transaction volumes in the physical market ended 2024 at the highest level since mid-2022. Reinforcing this outlook, the spread to net tangible assets (NTA) in the real estate listed equity markets has reduced and, in some instances, has turned into a premium; a notable gain from the average ~30% discount a year ago.
Broker and valuation forecasts, supported by increased transaction evidence, point toward the stabilisation in capitalisation rates across the Prime core real estate sectors (see Chart 2).
Note: Capitalisation rate is calculated by dividing net operating income by a property's current market value. A higher market value implies a lower capitalisation rate.
Chart 2: Indicative market capitalisation rates across the Prime Office, Industrial & Logistics (I&L) and Neighbourhood Retail sectors
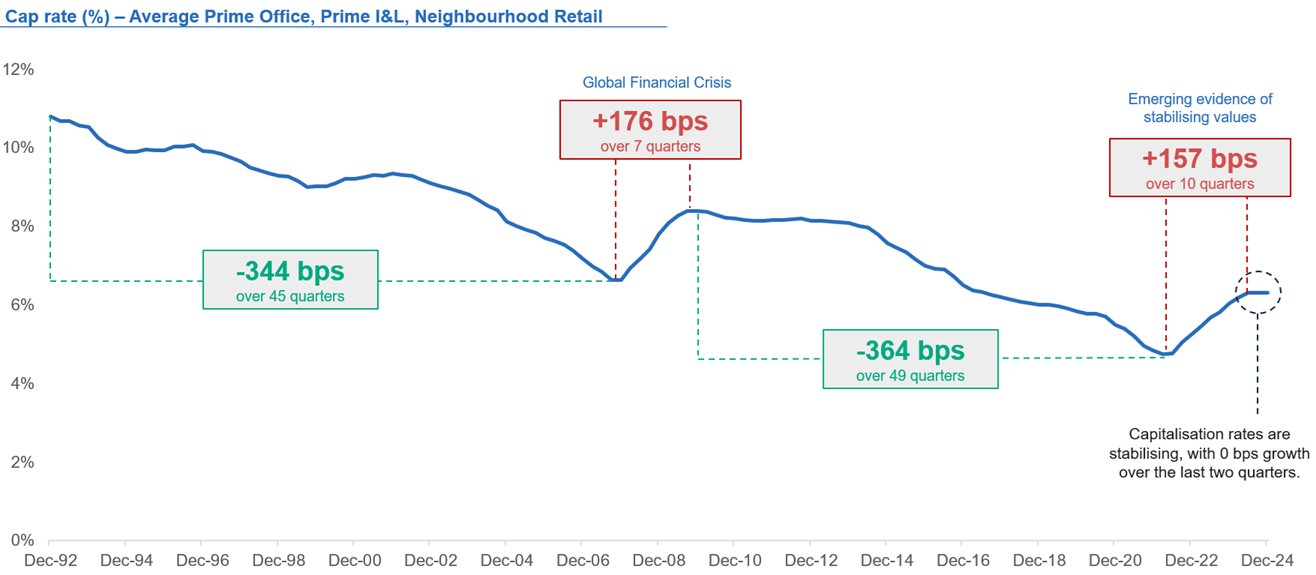
Source: JLL Research, Charter Hall Research. Click to enlarge.
2025's office market: perception, reality and the great opportunity
Office had the largest reduction in property values (-21%) in the recent downcyle, given the uncertainty cast by the pandemic lockdowns and the capacity for demand to absorb a surge of lagged new supply completions. However, with return to office mandates now becoming more prevalent, the sector is rebounding with an increase in tenant demand.
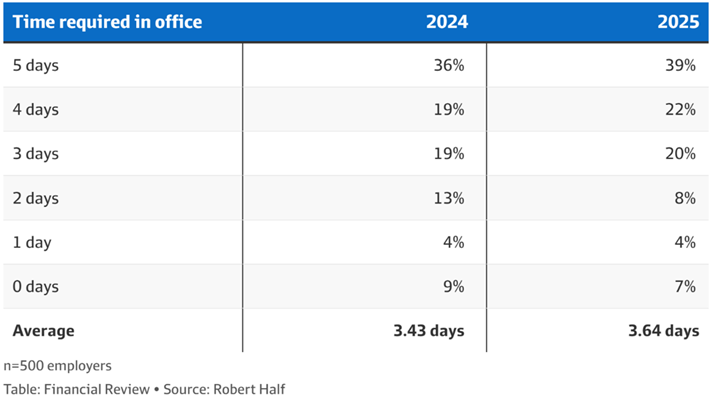
The trend back into the office continues to accelerate (see Table 2) as the limitations of non-office attendance become patently clear to companies and government entities look to drive productivity and their corporate culture. Since the end of the lockdowns, the occupied stock across Australia’s Prime Office market has increased by 9%; the third strongest growth globally.
Table 2: Return to office mandates (% employers)
Ironically, meaningful reductions to office space in flexible arrangements could only be achieved by reducing staff flexibility. The increase in flexible working did not translate to a contraction in office occupied stock. Prime office area increased with a growing workforce; and tenancy areas were mostly maintained or increased.
Desk sharing arrangements proved to be impractical for most firms as this confined talent to fixed or advanced-booking schedules. This was challenged by the dynamic preferences of staff and the ebb and flows of workflow. Contingent desk space was a mechanism for flexibility. Flexible policies also require greater collaborative and communicative space (i.e. more meeting rooms).
A growing chorus of major organisations have expressed the significance of office-centred cultures and intensified efforts to encourage attendance, including more rigorous mandates and bonus-linked attendance. To incentivise the return and office productivity, firms have also focused on the quality of the offering through improved amenities.
Cyclical and secular forces are moving in favour of the office market
Asset pricing looks set to be supported by the downward trajectory of interest rates and borrowing costs. Meanwhile, higher construction costs have endured and existing asset values sit well below their replacement costs. This has led to a significant reduction in forward supply.
Office assets typically have longer lead-times given the asset, planning, and locational complexities. As such, the next decade will likely be affected by a period of undersupply for modern office assets in core CBD locations. Existing assets with superior credentials will benefit from greater pricing power. This trend has already emerged in markets such as Brisbane, where insufficient supply has contributed to effective rent growth of 20%+ over the past two years.
As detailed in Charter Hall's recent ‘Why Australia’ report, this should unfold against the backdrop of long-term economic fundamentals that continue to strengthen against the other major global economies and contribute demand across the Prime Real Estate sector.
Over the next decade, Australia has the strongest economic, population and employment growth forecasts – between two to four times greater than the G12 nation average growth rates. In a world with rapidly ageing populations, Australia benefits from a younger and more productive population.
Office demand also continues to benefit from a range of enduring mega trends, headlined by the AI transformation. AI jobs are forecast to increase by above 164,000 by 2030 and generate between 800,000 sqm and 1.3 million sqm of additional office space demand. Moreover, technological advances have accelerated white-collar job growth over recent years in industries such as cybersecurity, tax, defence and automation.
Looking ahead, these trends are expected to continue, with leasing volume growth to be supported by the positive economic momentum against the backdrop of declining office supply. We are of the view that the earlier correction in asset values was largely cyclical, as markets adjusted to higher interest rates and slowing economic conditions. As this trend recedes and secular tailwinds strengthen, high-quality offices are providing appealing forward-looking return profiles.
Sources: JLL Research, Morgan Stanley, ABS, Oxford Economics, Tech Council of Australia, Charter Hall Research.
Steven Bennett is Chief Executive of Direct Property and Sasanka Liyanage is Head of Research at Charter Hall Group, a sponsor of Firstlinks. This article is for general information purposes only and does not consider the circumstances of any person, and investors should take professional investment advice before acting.
For more articles and papers from Charter Hall, please click here.