The idea that share prices have historically done better in January than in other months is referred to as the ‘January effect’. Since January 2016 was such a bad month for shares in Australia and around the world, I have had more questions than usual from investors about this phenomenon.
In Part 1 we look at whether there is in fact a ‘January effect’ in the US (where the theory originated) and in Australia.
Then in Part 2 we will look at what January’s returns can tell us about the likely returns for the rest of the year.
The ‘January effect’ in the stock market
In the US stock market, January has delivered above-average returns from shares relative to other months of the year. This phenomenon has been observed at least as far back as the 1920s. I recall first reading about it in the 1980s, and it is still referred to as a market ‘anomaly’ or ‘inefficiency’.
Various logical explanations have been put forward. Most relate to the timing of tax payments and end-of-year bonuses which are invested in shares in January. Other explanations include optimism from the festive season and year-end reflections and commitments to start or accelerate investment plans in the New Year.
This market inefficiency sounds like a way to make easy money. If it were true, we could simply over-weight shares in January and then go under-weight for the rest of the year, generating higher returns than by than simply remaining passive and sticking to the same allocation for the whole year.
Surely the market would not allow such an obvious inefficiency to last for long?
The first pair of charts show price returns from US shares in January compared to the average of all months, using the S&P Composite/S&P500 price index returns from US shares from 1900 to the end of 2015.
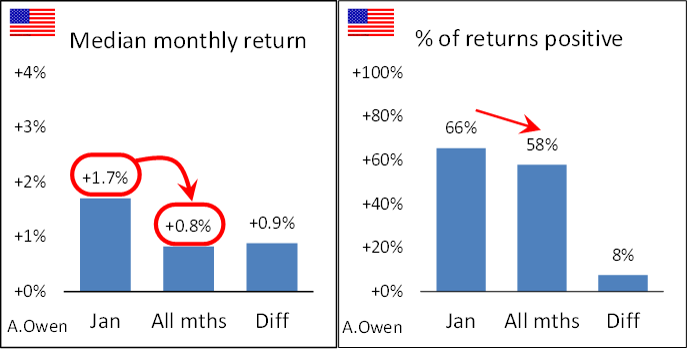
The left chart shows the median January return was 1.7%, which has been double the median return from all months. This difference is statistically significant, not a random aberration. The right chart above shows that monthly returns have been positive in 58% of all months, but positive in 66% of Januaries, so the incidence of losses in January has been lower than in other months.
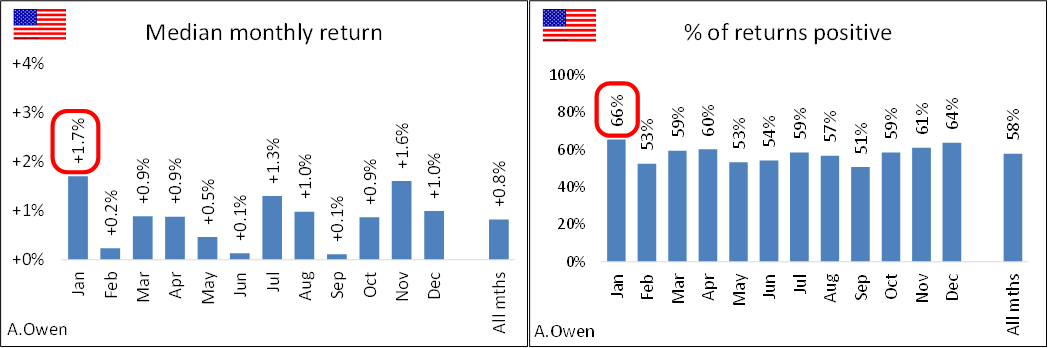
Indeed, averaged over the whole period since 1900, January has been the best month for US shares. January has had the highest median monthly price return of all months (left chart below) and the highest incidence of positive results, meaning the lowest incidence of negative months (right chart below).
So far so good. We could buy or go overweight the market (for example, via a broad market ETF) at the end of December or the start of January and then sell or underweight at the end of January, wait eleven months and do it again next year, and so on.
What’s the problem?
The problem is that the ‘January effect’ has been so extensively written about that it has been ‘arbitraged away’ (exploited so much that the advantage no longer exists) since the 1990s.
The following charts show the January effect by decade:
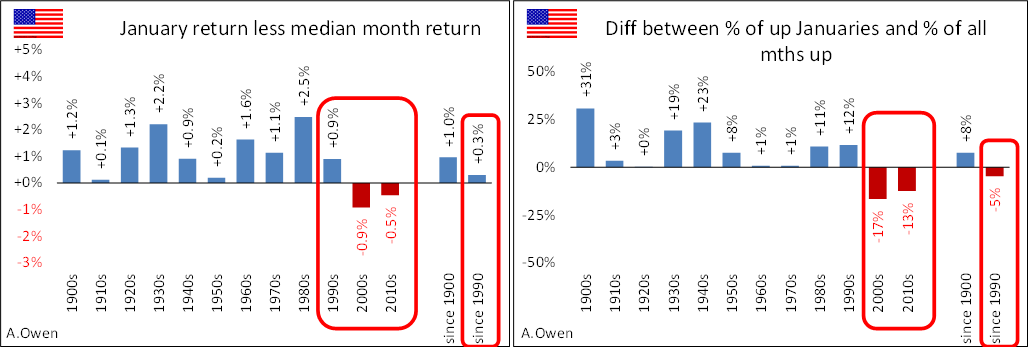
The left chart shows the excess of January returns over returns for all months. A blue bar means January returns were higher than the overall monthly average return, and a red bar means January returns were lower than the monthly average. The right chart above shows the excess of January incidence of positive months relative to all months. A positive blue bar means Januaries had higher incidence of positive returns than other months.
The January outperformance varied over time but it was consistently positive until it disappeared since the 1990s.
Why? The ‘January effect’ was exploited by a few large investors who had enough scale, access to markets and instruments to overcome the high costs involved in exploiting the anomaly. Since the 1980s, the advent of cheap computing, lower brokerage, accessible futures markets, the rapid proliferation of hedge funds and low cost ETFs has meant that everybody could now try to exploit this ‘free lunch’. Further, the charts show that it may have even reversed in the 2000s and 2010s.
Is there a ‘January effect’ in the Australian stock market?
Just like in the US, there has also been a January effect in Australia over more than a century since 1900.
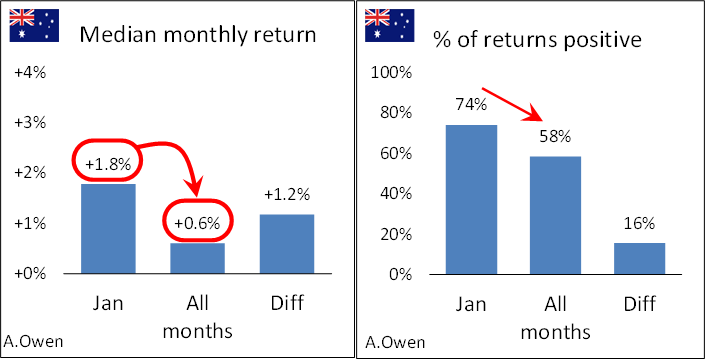
The left chart shows the median January return was 1.8% (similar to the US). In Australia the median January return has been three times the overall return over all months, even more than in the US. The right chart above shows that monthly returns have been positive in 58% of all months (similar to the US), but positive in 74% of Januaries (even higher than 66% of Januaries in the US).
Averaged over the whole period, January has also been the best month for the Australian stock market, as it has been in the US:
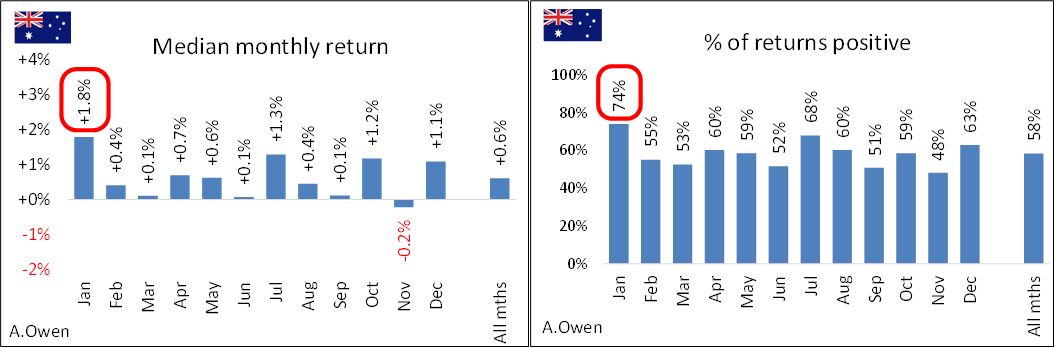
So the January effect has been even more pronounced in Australia than in the US market.
Although the timing of tax payments in Australia is different from the US, and year-end bonuses are not as extensive here, the January effect has still been present in Australia. One reason may be that the Australian market has always been heavily influenced by foreign money flows and our local market has been a natural beneficiary of the US effect. Another reason may be to do with investors re-balancing and setting up new portfolios after December year-end reviews.
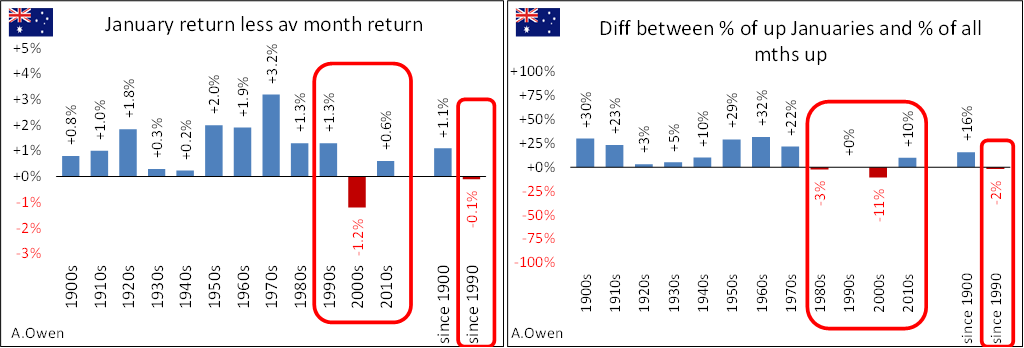
However, just like in the US, the ‘January effect’ has not been present in Australia since the 1990s.
There’s no such thing as a free January
Stock markets, like all markets, contain market inefficiencies - ‘free lunches’ – from time to time. Some last for short periods before being discovered, exploited and arbitraged away. Others can persist for long periods before being lost due to the use of new technologies, instruments or changes in market structure. Hedge funds often find a market inefficiency, exploit it quickly before the rest of the market joins the party and closes the gap, and then go in search of the next inefficiency.
The ‘January effect’ persisted for more than a century but alas it has disappeared.
(In Part 2, we will look at what January’s returns can tell us about the likely returns for the rest of the year).
Ashley Owen (BA, LLB, LLM, Grad. Dip. App. Fin, CFA) has been an active investor since the mid-1980s, a senior executive of major global banking & finance groups, and currently advises high net worth investors and advisory groups in Australia and Asia. This article is general information and does not consider the personal circumstances of any individual.