One of the most anticipated slide decks in Silicon Valley is Mary Meeker's Internet Trends Report. The Kleiner Perkins Caufield & Byers partner (and former Morgan Stanley tech analyst) has just released her 294 slides at the Code Conference in Rancho Palos Verdes, California.
Smartphone sales and internet usage
Here are some of the key takeaways as reported by recode.net.
2017 was the first year in which smartphone unit shipments didn't grow at all. As more of the world become smartphone owners, growth has been harder and harder to come by (see first chart).
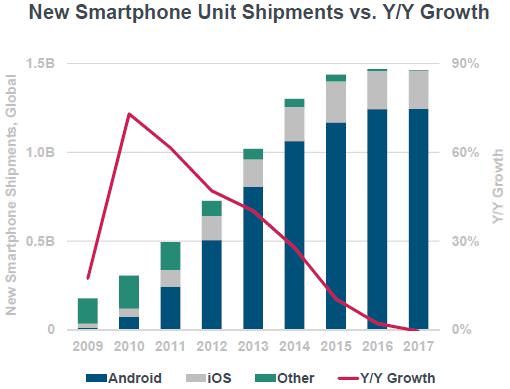
Source: Internet Trends 2018 by Mary Meeker/Kleiner Perkins Caufield & Byers, IDC.
Internet user growth has also been slowing. It rose 7% in 2017, down from 12% the year before (see second chart). With more than half the world online now, there are fewer people left to connect.
However, people are still increasing the amount of time they spend online. Adult Americans spent 5.9 hours per day on digital media in 2017, up from 5.6 hours the year before. Some 3.3 of those hours were spent on a mobile device, and that is driving overall growth in digital media consumption.
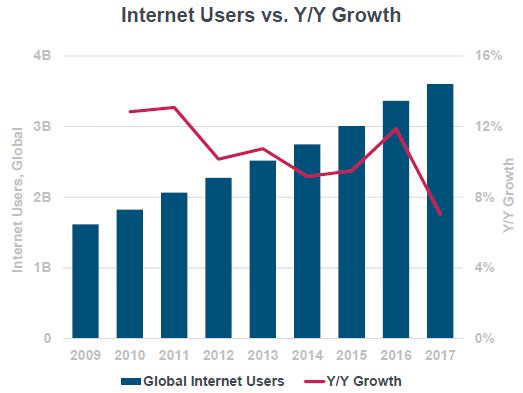
Source: Mary Meeker/Kleiner Perkins Caufield & Byers, UN, US Census Bureau
Despite the high-profile releases of the US$1,000 iPhone X and Samsung Galaxy Note phones, the global average selling price of smartphones is continuing to decline. Lower costs help drive smartphone adoption in less-developed markets.
Trends in e-commerce
Mobile payments are becoming easier to complete. China continues to lead the rest of the world in mobile payment adoption, with over 500 million active mobile payment users in 2017.
Voice-controlled products like Amazon Echo are taking off. The Echo's installed base in the US grew from 20 million in the third quarter of 2017 to more than 30 million in the fourth quarter.
Tech companies are facing a "privacy paradox". They're caught between using data to provide better consumer experiences and violating consumer privacy.
Tech companies are becoming a larger part of the US economy. In April 2017, they accounted for 25% of US market capitalization. They are also responsible for a growing share of corporate R&D and capital spending.
E-commerce sales growth is continuing to accelerate. It grew 16% in the US in 2017, up from 14% in 2016. Amazon is taking a bigger share of those sales at 28% last year. Conversely, physical retail sales are continuing to decline.
Big tech is competing on more fronts. Google is expanding from an ads platform to a commerce platform via Google Home Ordering. Meanwhile, e-commerce giant Amazon is moving into advertising.
People are spending more on health care, meaning they might have to be more focused on value. Ms Meeker asks, "Will market forces finally come to health care and drive prices lower for consumers?" Expect health care companies to offer more modern retail experiences, with convenient offices, digitized transactions and on-demand pharmacy services.
The speed of technological disruption is accelerating. It took about 80 years for Americans to adopt the dishwasher. The consumer internet became commonplace in less than a decade.
Expect technology to also disrupt the way we work. Just as Americans moved from agriculture to services in the 1900s, employment type will again be in flux. This time, expect more on-demand and internet-related jobs to predominate.
Internet leaders like Google and Amazon will offer more artificial intelligence (AI) service platforms as AI becomes a bigger part of enterprise spending.
The key players – China and the US
China is catching up as a hub to the world's biggest internet companies. Currently, China is home to 9 of the world's 20 biggest internet companies by market cap, while the US has 11. Five years ago, China had 2 and the US had 9.
Immigration remains important for US tech companies. More than half of the most highly valued tech companies in the US are founded by first- or second-generation immigrants. For example, Uber, Tesla, WeWork and Wish all have first-generation founders.
Specific smartphone forecasts are provided by International Data Corporation (IDC), a leading global provider of market intelligence for the IT, telecommunications and consumer technology markets with over 1,100 analysts worldwide. According to new IDC data, the global smartphone market declined 0.3% last year and will contract again this year before returning to growth in 2019.
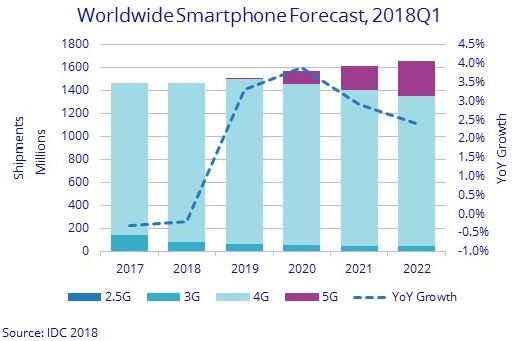
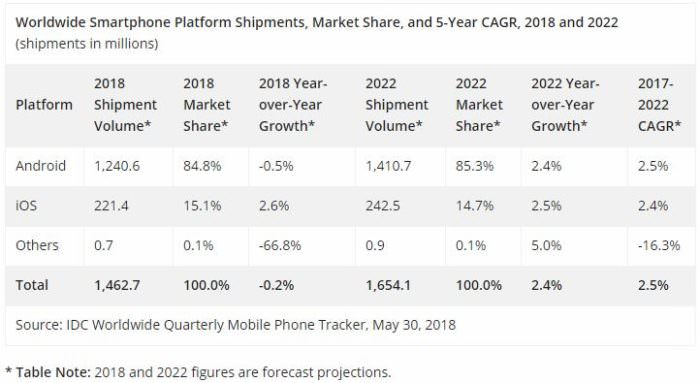
IDC expect worldwide smartphone shipments to drop 0.2% again this year to 1.5 billion units, but expect a roughly 3% annual growth from 2019 on with shipments reaching 1.7 billion in 2022, giving a 5-year CAGR of 2.5%. IDC's forecasts can be seen in the chart and table below.
The biggest driver of the 2017 downturn was China, which saw its smartphone market decline 4.9% year-on-year. Tough times are expected to continue in 2018 as IDC forecasts consumption in China to decline another 7.1% before flattening out in 2019. The biggest upside in the Asia Pacific region continues to be India, with volumes expected to grow 14% in 2018 and 16% in 2019.
Chinese mobile phone manufacturers will continue their strategy of selling large volumes of low-end devices by shifting their focus from China to India. So far most have been able to get around India's recently introduced import tariffs by doing final device assembly at local Indian manufacturing plants. As for components, almost everything is still being sourced from China.
The other catalyst to watch will be the introduction of 5G smartphones. IDC predicts the first commercially ready 5G smartphones to appear in the second half of 2019, with a ramp up across most regions happening in 2020. It also projects 5G smartphone volumes to account for roughly 7% of all smartphones in 2020 or 212 million units in total. The share of 5G devices should grow to 18% of total volumes by 2022.
Although overall smartphone shipments will decline slightly in 2018, IDC projects the average selling price of a smartphone to reach US$345, up 10.3% from the US$313 average in 2017.
There is no question that Google's Android is the operating system of choice for the mass market (rather than Apple's iOS) and nothing leads IDC to believe this will change. Given the large number of Chinese phone makers dependent on Android, as well as components from other US companies such as Qualcomm, it will be interesting to see how things develop given all the discussion about a potential US-China trade war.
Marcus Tuck is Head of Equities Research at Mason Stevens. This article is general information and does not consider the personal circumstances of any individual.