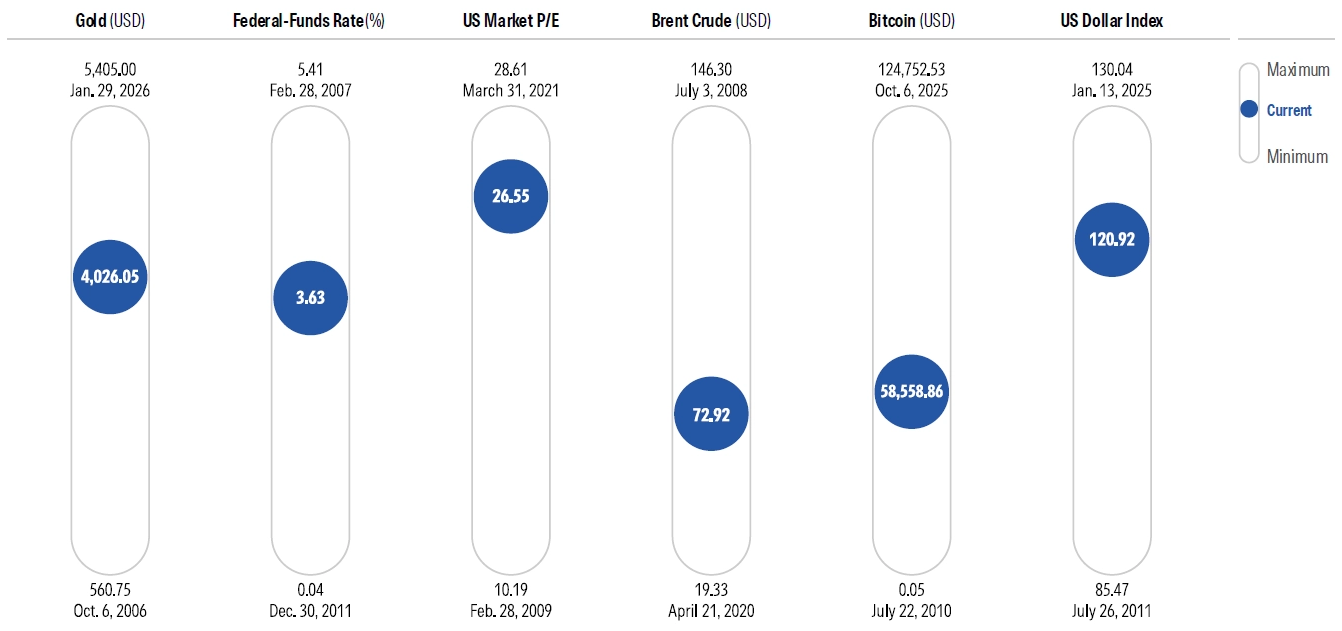
One of my favorite pieces of research is the Morningstar Markets Observer, which offers a wealth of information from a big-picture perspective. Particularly interesting is the report’s “Market Thermometer” chart, which shows six key metrics and where each one stands relative to its range over the past 20 years.
I like this chart because it packs in so much information; even without reading all the details, you can get a quick picture of where major asset class prices stand. Overall, the picture looks less alarming than it did six months ago, the majority of assets we measured are still trading above average compared with their historical ranges over the past two decades.
Gold
Current level: Above average.
What it means: Gold has fallen below peak levels, but the price remains relatively high.
Gold has had a strong run in recent years. After a 25% runup in 2024, it surged by nearly 70% in 2025. By the end of January 2026, it reached a peak of more than $5,400 per ounce. This performance was partly driven by central banks around the world buying up gold as they “de-dollarize” their reserve assets, as well as other investors seeking a safe haven amid macroeconomic turmoil and geopolitical uncertainty.
Since then, though, gold prices have fallen sharply, partly reflecting market expectations for higher yields on bonds and a stronger US dollar. By the end of June, gold was priced at about $4,026 per ounce—nearly 25% below its earlier peak.
Despite this decline, gold is still trading at an elevated level, suggesting caution may still be warranted. As academic researchers Campbell Harvey and Claude Erb have found, there’s some evidence that gold prices tend to revert to the mean over longer periods. When gold is trading at elevated prices in inflation-adjusted terms, prices have often declined in subsequent periods. That happened in 1980, when steep prices were followed by a long period of sluggish returns during most of the following decade. The same pattern showed up when the real price of gold reached a peak in August 2011, which was followed by a sharp downturn from 2013 through 2015.
In short, while gold is more attractively priced than it was six months ago, it still carries a fair amount of downside risk.
Federal-Funds rate
Current level: Above average.
What it means: Even after a rate cut in December 2025, yields on cash are still higher than inflation, making fixed-income securities relatively attractive.
The midpoint of the target range for the federal-funds rate stood at about 3.64% as of June 30 (the date for all of the data above), down from a high of 5.33% in 2024. However, the fed-funds rate remains significantly higher than its low of 0.04% as of late 2011, when the Federal Reserve’s zero interest rate policy reached its nadir. In the wake of the global financial crisis, the Fed aggressively dropped short-term rates to near zero to stabilize the economy. It also purchased US Treasuries and agency mortgages as another way to keep bond yields low. ZIRP and successive rounds of quantitative easing led to a nearly 15-year period of low borrowing costs.
Fast forward to March 2022, and ZIRP became a distant memory as the Fed embarked on a series of aggressive interest rate hikes to tamp down inflation. But even now that rates have once again been moving lower, yields on cash and short-term securities remain relatively attractive. For example, the three-month Treasury bill yield of 3.86% as of July 29, 2026, remains slightly higher than the most recent annual inflation rate of 3.5%. As a result, investors saving for short-term goals don’t need to worry about the value of their savings eroding over time, at least for the moment.
More broadly, yields on high-quality fixed-income securities remain significantly higher than they were a few years ago. When rates were extremely low, there was nowhere for yields to go but higher and nowhere for bond prices to go but lower. Now we’re clearly in a different environment, making bonds more attractive than they were a decade ago.
US market P/E
Current level: High.
What it means: US stocks have been the best-performing major asset class over the past 20 years. Aside from a couple of brief downturns, US equities have continued to power ahead, with price gains driven by growth in corporate earnings as well as multiple expansion. As a result, the overall price/earnings ratio for the Morningstar US Market Index has more than doubled from its low of 10.19 in the wake of the global financial crisis. The benchmark’s P/E as of June 30, 2026, was down slightly from a peak of 28.61 but still on the high end of the range over the past 20 years.
Equity valuations could remain elevated if corporate earnings continue to deliver, but high prices also mean stocks have more room to fall if growth falls short of expectations. And now that valuations have already climbed higher, there’s not as much room for future multiple expansion as a driver of equity market returns.
While the US market as a whole isn’t in the bargain bin, there are still some pockets of value available for price-conscious investors. Valuations for non-US stocks, in particular, remain lower than those of their domestic counterparts, despite the strong gains in non-US stocks in both 2025 and 2026.
Brent Crude
Current level: Relatively low.
What it means: Consider adding a small position in a broad-based commodities fund that includes energy exposure for inflation protection.
The price of oil has been subject to dramatic highs and lows over the past 20 years. At the beginning of the period, prices surged, driven by growing demand from China and other emerging markets, combined with limited supply. As a result, prices reached a peak of about $146 per barrel in July 2008. That was followed by a precipitous drop during the global financial crisis, when the price dropped by more than 50%. Prices partially recovered over the next few years, only to suffer sharp losses in 2014 and 2015 as the OPEC group of major oil-exporting countries kept production levels high, leading to a glut in supply. Fast forward to the pandemic, and oil prices reached a low of $19.33 per barrel in April 2020.
Since then, oil prices have significantly increased, thanks mainly to the Iran war and supply disruptions stemming from blockades in the Strait of Hormuz. As a result, Brent crude prices were up about 45% for the year to date through June 30, 2026. Even after that increase, though, oil prices remain at only about half their peak levels in 2008.
Although oil prices are likely to remain volatile and would likely suffer in the event of an economic slowdown, a small stake in a broad-based commodities fund that includes exposure to energy could help improve portfolio diversification and hedge against inflation for investors who can tolerate risk.
Bitcoin
Current level: Below average.
What it means: Although bitcoin remains a speculative asset, the price looks more attractive compared with its peak levels in October 2025.
After the pseudonymous Satoshi Nakamoto mined the initial genesis block on the bitcoin blockchain in early 2009, initial purchases could be made for pennies on the dollar, with a low price of $0.05 per bitcoin in July 2010. After a 15-fold price surge between 2019 and late 2021, for example, it fell by nearly 70% between November 2021 and December 2022. After hitting triple-digit returns in both 2023 and 2024, it reached a peak of about $125,000 per coin in October 2025. By June 2026, it was trading at less than half of that level.
The potential passage of the Digital Asset Market Clarity Act (stalled in the Senate at the moment), would be one possible catalyst for a bitcoin recovery. A more dovish Fed, easing inflation pressures, and lower real interest rates in 2027 and 2028 could also provide greater support for bitcoin prices.
However, potential buyers should still be mindful of bitcoin’s extreme price volatility. In addition, it’s tough to pin down a reasonable price for bitcoin because it doesn’t generate cash flows. And while the digital asset has started to gain more credibility among institutional investors, it remains a speculative asset with price swings often driven by fear of missing out.
US Dollar index
Current level: Relatively high.
What it means: The dollar could weaken further over the next several years.
For years, the US dollar seemed unstoppable. The Nominal Broad U.S. Dollar Index hit a low of 85.47 in July 2011 and mostly continued marching upward over the next 15 years or so. Turmoil in other markets was one reason behind the dollar’s extended climb. As countries such as Greece, Italy, Portugal, and Spain grappled with unsustainable debt levels, investors fled euro-denominated assets and took refuge in the dollar.
Generally strong economic growth and rising corporate earnings in the US also bolstered the dollar, as did the greenback’s undisputed position as the world’s leading reserve currency.
That narrative has started to change. During 2025, the Nominal Broad U.S. Dollar Index dropped about 7%. However, the current index value of 120.92 remains at the high end compared with the dollar’s range over the past 20 years. Central banks around the world have been “de-dollarizing” their reserves by purchasing both gold and other currencies. The rising federal debt, which is equivalent to 124% of gross domestic product, could also weaken investor confidence and further decrease demand for dollar-based assets. Morningstar US chief economist Preston Caldwell expects the US Fed to resume a series of rate cuts in 2027 and 2028, which would be another factor depressing demand for dollar-based assets.
Amy C. Arnott, CFA, is a portfolio strategist for Morningstar. This article does not consider the circumstances of any investor. Minor changes have been made to the original US version for an Australian audience.