Local investors have a good appetite for Australian small- and medium-cap companies, but there’s a huge universe of global companies in this category that are also worth considering.
We classify global small and mid-cap (SMID) companies as those with a market capitalisation from US$1 billion to US$28 billion (A$41 billion). They are vastly larger than the types of companies considered SMID in Australia. This approach to global SMID ensures an investible universe of diversified, liquid and highly profitable stocks. Some of the most interesting companies with the strongest franchises are found in the global SMID sector and include luxury car brand Ferrari; PoolCorp, the largest wholesale distributor of swimming pool supplies in the world; US beauty store chain Ulta Beauty; and Moncler, which sells down jackets and other clothes.
There are many differences when it comes to the Australian versus global SMID market. For instance, size is one of the advantages of the global universe versus its Australian counterpart. The global cohort is much larger, more liquid and companies tend to be of a higher quality.
Additionally, it’s much easier to find companies with the potential to generate value among overseas businesses. Because of the larger universe of opportunities, allocating large amounts of capital to global SMID is also more straightforward than allocating funds to Australian small caps.
Another reason to consider global SMID is because global equities portfolios have changed in recent years. In the world of global equities, it’s no secret that large-cap growth stocks, especially the giant tech stocks, have accounted for much of the recent gains in equities. As such, many portfolios have become more heavily-skewed towards the larger cap end of the market. This is opening up opportunities to invest in the global SMID to gain exposure to a big part of the global equity market that can provide growth.
Managing valuation risk
At a time when valuations in global large-cap stocks and are hitting new highs, global SMID looks increasingly attractive. When compared to the Australian small-cap market (the S&P/ASX Small Ordinaries Index), the global SMID cap index is actually less expensive – the MSCI World SMID Cap Index P/E at 18.6 vs the S&P/ASX Small Ordinaries Index P/E at 19.7x vs its five-year average of 16.4.
Furthermore, the global SMID universe simply has not participated in the valuation expansion that has been so prevalent with large-cap global growth and IT names. The MSCI World Global SMID Cap Index is now trading at its lowest P/E premium to the MSCI World Index in 10 years (+7.8% vs +15.6% 10-year average), which is in stark contrast to the global IT sector, which trades at a 33% premium to the rest of the market.
Absolute and relative P/E of the MSCI World SMID Index over 10 years.
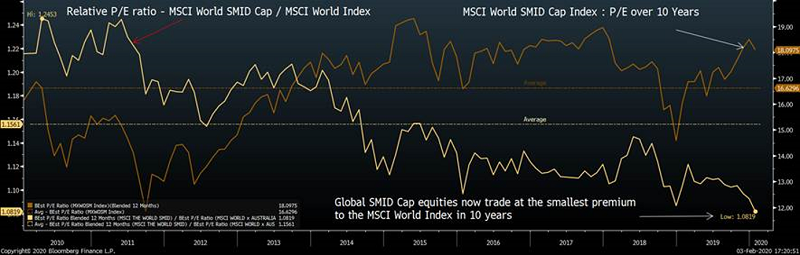
Source: Bloomberg.
An allocation to global SMID also offers a much better value proposition than mega cap names that have driven markets in recent years i.e. Apple, Microsoft, Amazon, Facebook and Alphabet. The valuation risk in these names has grown as their average P/E now sits at 29x and their average P/E premium to the market sits at 89%.
Three themes to watch
Three themes emerged during Bell Asset Management’s recent global research visit.
First, the strength of the US labour market. In 2019, more than 2.1 million extra people gained employment. As the market tightens, a lack of skilled labour and labour availability is emerging as a challenge for US businesses. This bodes well for the US economy this year and the small to medium-cap companies in it.
Second, according to official Chinese data, economic growth is running at 6%, but anecdotal evidence suggests this figure could be much lower. This is a risk to watch in 2020, one that could have flow-on effects to European economies in particular.
The outbreak of the coronavirus in China represents yet another challenge for their economy. While the bulk of the near-term pain will clearly be felt domestically, the ramifications for global businesses with meaningful China exposure are quickly becoming apparent. Some of the larger global players in the luxury, restaurant, travel and tech industries have already flagged that earnings will suffer.
From an asset allocation perspective, the coronavirus has highlighted the inherent risks in two of the best known 'growth sleeves' in global equities – large cap growth (valuation risk) and emerging markets (macro and earnings risk). It also highlights two compelling attributes of the global SMID asset class: they come with meaningfully less valuation risk, and as companies domiciled in developed markets, they tend to be more domestically-focused.
Third, a related theme is the US/China trade war and global capex spending, which has been on hold since February 2019. Investors have been looking for some pent-up demand in capex spending to stimulate economic growth, especially in Europe. But our research suggests this is not yet happening. Capex plans are still on pause, although this may change as the US and China have recently come to some resolutions around the trade war.
Markets have recovered since reaching a nadir in January 2019. While there are concerns about how much further they could rise, we believe they still have some way to run. Brexit’s resolution, which could prompt an uptick in economic growth, is one reason for this. The US job market’s strength is another signal markets could outperform in 2020. Time will tell how these themes play out and how they will affect global small and mid-cap companies.
Ned Bell is Chief Investment Officer and Portfolio Manager at Bell Asset Management, a Channel Capital partner. Channel Capital is a sponsor of Firstlinks. This information should not be considered advice or a recommendation to investors or potential investors in relation to holding, purchasing or selling particular assets and does not take into account your particular investment objectives, financial situation or needs.
For more articles and papers from Channel Capital and partners, click here.