Despite tariff-driven growth concerns and inflation fears, strong results from the latest US earnings season have taken markets by surprise, with over 80% of companies on the S&P 500 beating street estimates. This has further insulated the already-upbeat risk sentiment that has driven the S&P 500 to an all-time high in July.
Coming to the end of this earnings season, what are the key themes, company highlights, and emerging warning signs?
Almost too good to be true: a record run of beats
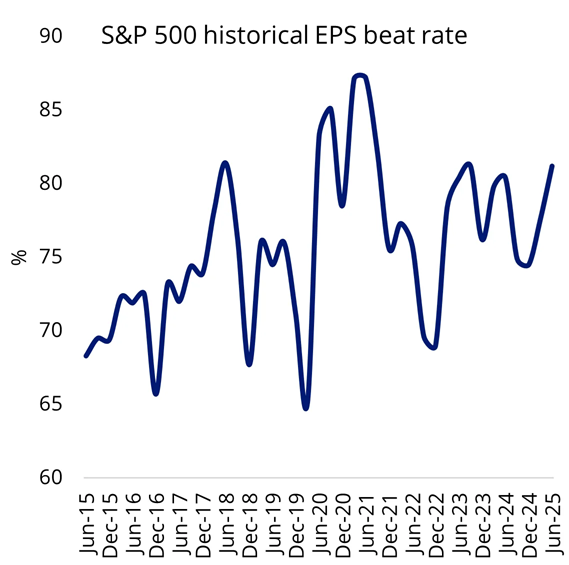
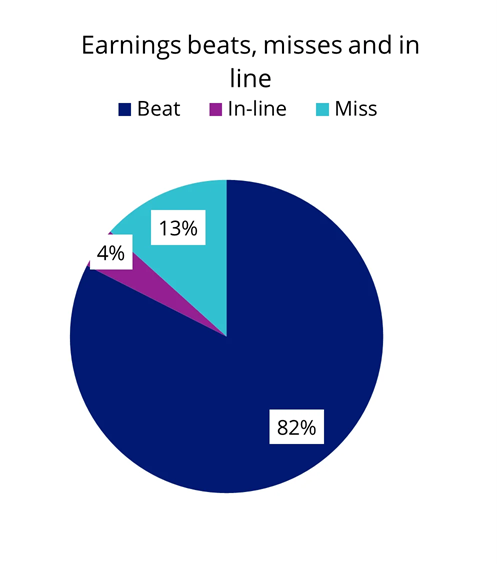
On an index level, markets have not seen this rate of earnings beats since December 2021. As of 1 August, ~82% of S&P 500 companies had delivered positive earnings surprises. Worth noting was the blended year-on-year EPS growth exceeding 9%, which is more than triple the pre-season sell-side consensus of 2.8%.
Charts 1 & 2: Q2 2025 saw the highest earnings beat since 2021
Source: VanEck. Bloomberg Intelligence. Date as of 31 July 2025.
This almost seems too good to be true: an upbeat earnings season unfolding against the backdrop of the most aggressive US tariff policy in nearly 100 years. Three main factors have softened the initial blow of US tariff aggression:
- A weaker US dollar has increased US exports’ margins and boosted overseas revenue (in USD terms) for US companies.
- Inventory frontloading ahead of the Tariff Liberation Day has provided a supply buffer for US companies to stabilise their input cost; and
- The global AI race has kept AI-related capex growing, boosting demand for high-margin tech goods and services.
However, with most trade negotiations complete, the terminal US tariff rate (15-17%) is set to linger at a level that offers almost no relief on inflationary pressure. As the three factors mentioned above fade over the coming months, US companies could feel increasing stress. This drag is partly mitigated by the government injecting fresh growth stimulus into the US economy, particularly in strategic sectors like technology and infrastructure.
The coming months will be a balancing act between these two competing forces. Smart investors should stay close to price target revisions, as Q3 earnings are likely to reveal a more complete picture of how well US corporates are digesting tariff challenges.
AI capex translates to strong earnings growth
On a sector level, technology (97%) and communications service (92%) companies, which are closely linked to the global AI race, have delivered the highest beat percentage.
Chart 3: Tech sectors led earnings beat
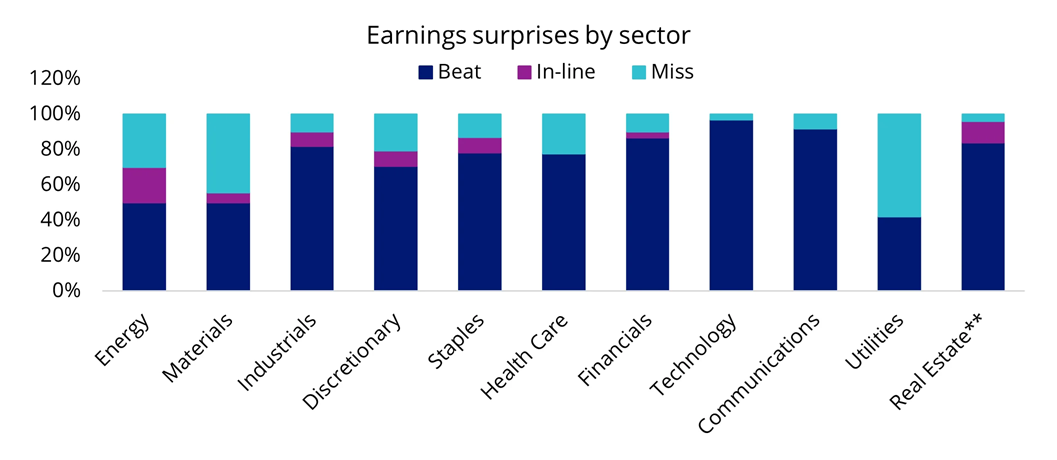
Source: VanEck. Bloomberg. Data as of 31 July 2025, in AUD. ** Beat, Hit, Miss counts are relative to FFO.
Within the ‘Magnificent 7’ group, (excluding Tesla, whose shares have plunged due to significant revenue decline (~12%) and margin compression (~17%)), the tech mega caps have delivered an average positive surprise of 12.4% [1], far exceeding the other 493 names (4.8%) in the benchmark, thereby maintaining their hyper-growth trajectory.
Chart 4: Magnificent 7’s EPS outgrows the broader market
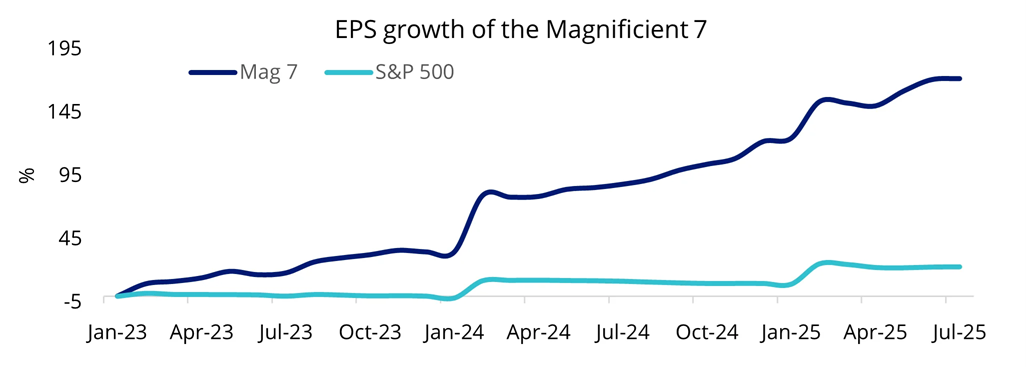
Source: Bloomberg. Mag 7 is Bloomberg Magnificent 7 Total Return Index. Date as of 31 July 2025.
Another highlight is the boost to AI-related capex projection: Alphabet (Google) has increased its AI budget to US$85 billion, up from US$75 billion. Microsoft is targeting US$80 billion. Meta is doubling its budget from FY24 to US$66-72 billion in FY25. Amazon is sticking to its US$105 billion target, and Apple, which currently lags its peers, is committing an additional US$100 billion toward US production and on-device AI initiatives. This scale of investment reflects the fierce pace of AI development and is interpreted by analysts as a structural tailwind for the broader tech sector.
From a valuation standpoint, while these companies remain richly priced, recent data shows that after the tech correction earlier this year, the gap between the Magnificent 7 and the broader market has narrowed meaningfully.
Chart 5: Magnificent 7 valuations revised closer to S&P 500
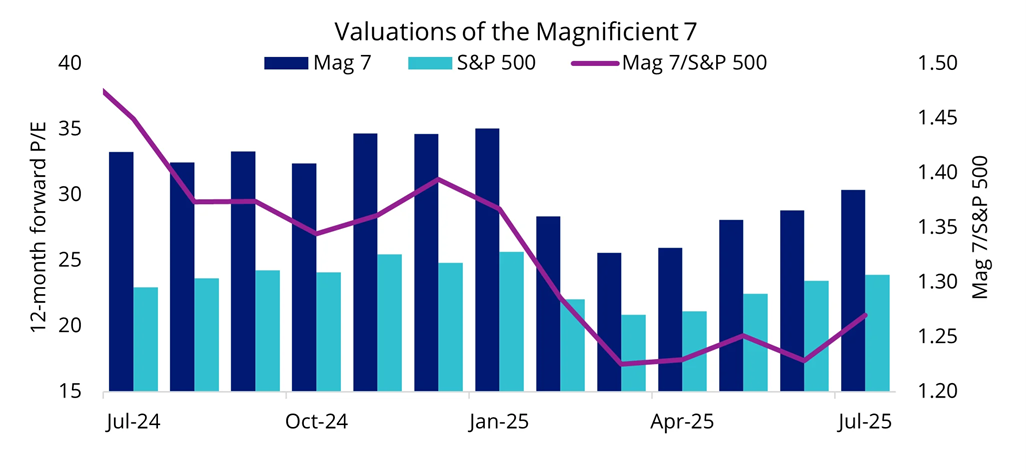
Source: Bloomberg. Mag 7 is Bloomberg Magnificent 7 Total Return Index. Data as of 31 July 2025.
Commodity-linked sectors starting to feel tariff damage
Contrasting with the success seen in the tech sectors, commodity-linked sectors (materials, utilities and energy) have seen over a third of reporting companies miss their estimates.
Companies in these sectors have limited ability to pass on tariff-driven input cost inflation, as materials and energy prices are typically determined by global spot market rates and are often subject to regulatory price ceilings.
Earnings misses punished harshly
While the June quarter earnings have generally exceeded expectations, there’s a sense of caution hidden in price reactions. As shown in the chart below, one-day share price gains following an earnings beat have ranged less than 2% relative to the broader index, whereas a single earnings miss could trigger a decline of 5–9%. This suggests that investors are disproportionately punishing earnings misses – a sign that expensive valuations at companies must be justified.
Chart 6: Earnings misses are met with outsized price declines
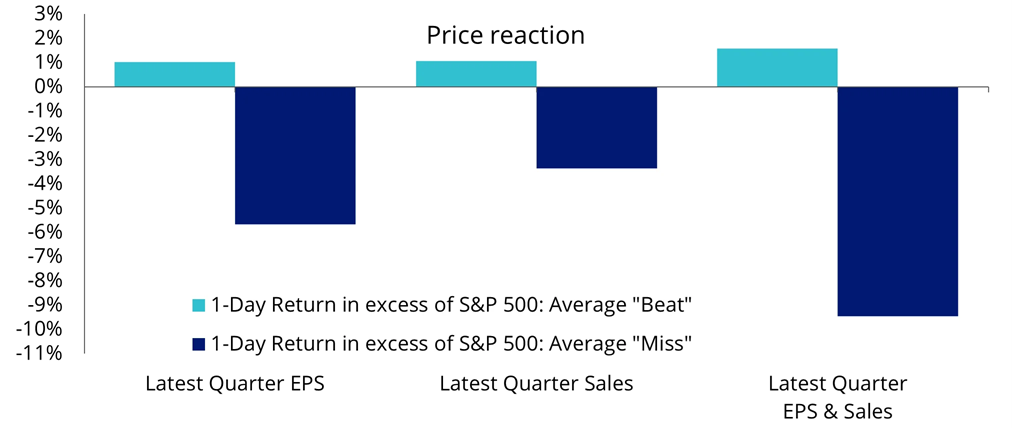
Source: VanEck. Bloomberg Intelligence. Date as of 31 July. Performance in USD.
Final thoughts
The second quarter of 2025 saw US tariff aggression shake up the world’s trade system. It’s too early to assess the full impact of these tariffs, but it feels unsettling. While robust corporate fundamentals, the AI boom and record foreign investment have kept this earnings season warm, a sense of caution can be seen in price reactions.
US companies could face a tougher test in the coming months as economic growth slows, flagged by the Fed and reflected in recent weaker economic data prints. While investors should welcome the AI-driven growth momentum, it is important to be selective.
[1] Based on blended sell side analysts estimates on Bloomberg.
Anna Wu is a Senior Associate, Cross-Asset Investment Research at VanEck, a sponsor of Firstlinks. This is general information only and does not take into account any person’s financial objectives, situation or needs. Any views expressed are opinions of the author at the time of writing and is not a recommendation to act.
The VanEck MSCI International Quality ETF (QUAL) tracks the MSCI World ex Australia Quality Index and invests in around 300 of the world’s highest quality companies. A hedged version of QUAL is also available for investors.
For more articles and papers from VanEck, please click here.