Hopefully you have never been to a concert where the band didn't play your favourite song. A good friend recently went to a Bruce Springsteen concert and she was disappointed that the Boss didn't play Born in the USA.
I know the feeling. Late last year I attended the plenary session at the Australasian Finance and Banking Conference. Held in collaboration with PwC and Finsia, the session topic was systemic risk and Nobel Laureate Professor Robert Engle provided the keynote address. Engle talked on systemic risk and not ARCH volatility models, the subject for which he is most famous. You could feel everyone in the room wishing for a play of the famous track.
I’ll discuss a little about both topics in this article.
Background of Robert Engle
Robert Engle studied physics and economics and his PhD was in the latter. He completed his PhD at Cornell University and spent time teaching and researching at MIT (Massachusetts Institute of Technology), University of Chicago; he is now at New York University’s Stern School of Business. Throughout, he has been an active teacher and a prolific researcher, and his research has tended to be quite mathematical using his physics background. Today Engle heads up VLAB (Volatility Laboratory), a free website supported by New York University, which provides real time measurement, modelling and forecasting of risk, financial volatility and correlations for a wide spectrum of assets. Anyone with a passing interest in risk management would find the website a great resource (http://vlab.stern.nyu.edu/).
Analysing volatility – the ARCH family of statistical models
Robert Engle is most renowned for his work on analysing volatility in financial markets. It was for this work that he was awarded the Nobel Prize in Economics in 2003. Up to the time of this research breakthrough in 1982, much of the academic modelling assumed that volatility was constant through time. Yet empirical evidence shows this not to be the case. Any chart of the daily movements in stock prices will demonstrate this.
Chart 1: Daily price movements in the ASX200 Index (data sourced from Yahoo! 7 Finance).
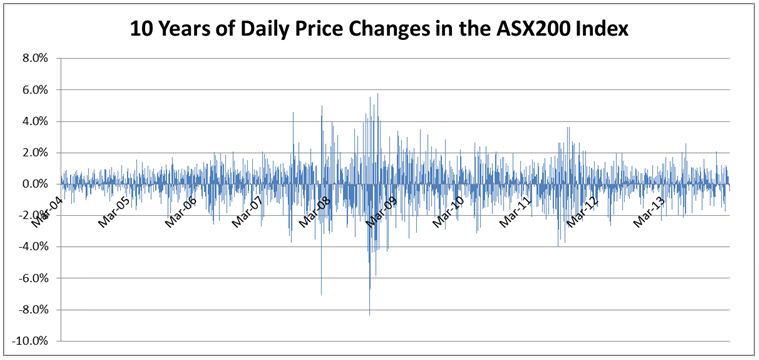
When we look at the chart above does it appear that the scale (absolute size) of the movements is completely random? The answer is no. We can see periods of market turbulence and then we can see periods where the market calms down and the scale of daily movements settles down. These effects are known as ‘volatility clustering’ and ‘volatility reversion’.
Engle’s contribution was to incorporate these two effects into a model which could be used to forecast future period volatility. The model developed is known as the ARCH model (ARCH stands for auto-regressive conditional heteroskedasticity – which sounds a little scary!). In simple words the model suggests that current volatility can be better estimated as a constant term plus a term based on the squared value of recent observations of market movements. If we are in a more volatile environment then there is a greater likelihood of a large movement (which could be up or down). Likewise if we are in a period of low observed volatility then the likelihood is that the next period’s market movement will also be subdued.
The ARCH model has been extended by many researchers into an ARCH family of models, and. GARCH is most commonly used. It extends the ARCH concept by saying that a better estimate of current volatility is based on a constant term plus a term based on recently observed volatility plus a term based on the squared value of recent observations of market movements.
Financial plan application
While this may all sound quite complex and academic the concept is intuitively appealing. If we are in a volatile environment we should take this into account when considering the current risk of our portfolios. These models are not used solely by academics; they are commonly used by banks and by some fund managers. This concept has much application to the design of financial plans and super funds. For instance, if someone is approaching retirement and worried about the potential for a large negative return then it would make sense to scale exposures to account for the current best estimate of volatility. There are not many examples of this approach being applied in practice (DFS Advisory Group is one exception I know of).
Systemic risk
The topic of the lunch however was systemic risk. VLAB provides estimates of systemic risk of financial firms around the world. These numbers are aggregated to produce country level estimates of systemic risk.
The logic of the calculation is as follows: a financial firm reaches a crisis point when the value of its equity falls to a sufficiently small fraction of its outstanding liabilities. If it is a difficult market environment the company may be unable to raise capital or be taken over and the government is faced with the choice of bailing out or letting the company fail – and so we have systemic risk. The essence of the systemic risk calculations is to estimate how much capital would be required by a firm in a financial crisis to maintain a minimum capital standard (in this case it is assumed to be 8% capital relative to asset value). Systemic risk changes with market volatility and capital position of the firm. On VLAB you can find a list of systemic risk estimates by firm which are aggregated to produce country level estimates (Chart 2) and global aggregates (Chart 3).
Chart 2: Global systemic risk by country at 3 March, 2014. Source: VLAB
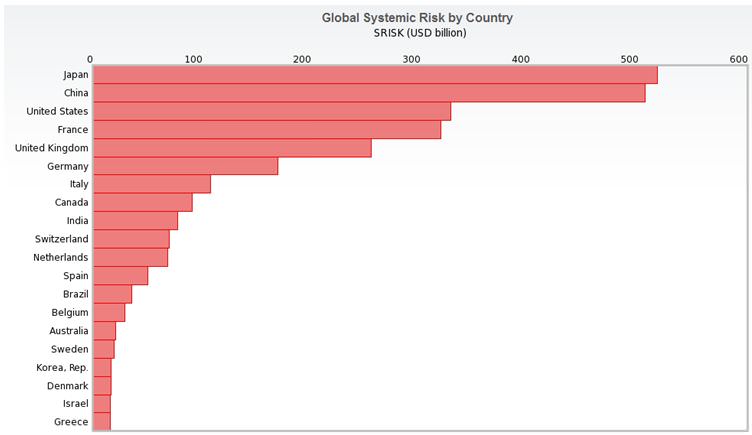
Chart 3: World financials total systemic risk through time. Source: VLAB
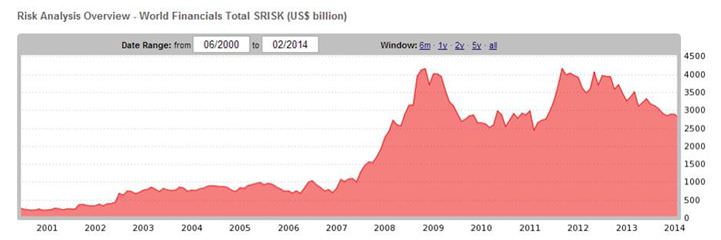
In chart 2 we can see it is currently Japan and China where VLAB estimates the greatest amount of systemic risk to reside. This suggests that the finance companies in those countries collectively have the greatest potential capital shortfall in a crisis event. Chart 3 suggests that while global systemic risk levels are below those seen during the GFC systemic risk remains at elevated levels.
What impresses about Robert Engle is that he is not living on the laurels of past successes. VLAB is an exciting free service provided for academics and market practitioners. You will find ARCH-like modelling in VLAB but it is one of many research calculations performed on the VLAB site.
While I walked away without hearing Engle’s most famous song, at least I was not left Dancing in the Dark.
David Bell’s independent advisory business is St Davids Rd Advisory. In July 2014, David will cease consulting and become the Chief Investment Officer at AUSCOAL Super. He is also working towards a PhD at University of NSW.