Traditional index funds weight the companies in a portfolio according to their market capitalisation, and ‘beta’ represents the return achieved from an exposure to the overall market in such an index fund. ‘Smart beta’ strategies, such as a wide range of non market cap indices, seek to retain the benefits of traditional indices (for example, broad market exposure, low cost, diversification and liquidity) with the potential for performance superior to a market cap index.
We are sometimes asked how we evaluate all the different smart beta strategies now available, such as indices based on selecting stocks according to their momentum, value, equal weighting or volatility. Most people are not looking for an exhaustive survey of all the options, but rather, they want to choose one and provide a solid basis for their choice.
The problem with style indices
Asset classes have desirable and undesirable characteristics. In some cases, it’s possible to separate the good from the bad and invest accordingly. But that’s what people thought they were doing when they bought into style indices in the 1990’s based on the work of Fama and French. Their analysis decomposed a strategy’s returns into independent components, such as market, value, size, and momentum. So it was possible to pick a portfolio which, for example, had a small company/value bias, and expect to outperform a cap weighted market index.
Then the one-two punch of the tech bubble and GFC deflated those illusions. It turns out that when the market is most poised for disaster, style indices are a way of asking, “Please, sir, I want some more.” One lesson is that identifying what makes sense for a core, ongoing, stable allocation is actually more difficult than devising a simple market-timing strategy.
More recently, opportunism has combined with genuine exasperation to push the expanding range of beta products to the limits of common sense, to the realm of the ‘scientific’ and beyond. And so a wide range of smart beta strategies are now available.
Evaluating smart beta strategies
We usually recommend the following characteristics in selecting a smart beta strategy:
- Rules-based, transparent, diversified, high capacity exposure
- Low cost
- Low turnover
- Better expected risk-adjusted returns and total risk than market cap.
But these criteria are just a laundry list of our own biases and preferences. They offer no compelling basis to choose one option over another other than that it should perform ‘better’ than market cap. Other criteria are inherited directly from market cap indices themselves.
Revisiting our assumptions, the whole smart beta exercise is premised on the idea that markets are inefficient and that there are systematic ways to avoid being on the wrong side of those inefficiencies.
Style indices, on the other hand, were premised on the idea that markets are efficient and that investors should pick and choose from a menu of factor risk premiums, since excess returns are only available through taking on more risk. But the deeply unsatisfying reality is that almost all smart beta strategies, like their style index brethren, offer no return premiums above the same menu of systematic risk factors. In other words, with very few exceptions, seemingly dissimilar strategies can be shown to be simple repackagings of each other using the style factors (market, value, size, and momentum) as building blocks.
When a strategy offers no residual return independent to these extremely simple factors, it is said to have no ‘alpha’ relative to them. A thorough analysis of this type was conducted on alternative equity index strategies in the Financial Analysts Journal in 2011. Its main finding was that they are all more or less equivalent to each other, but some are easier to implement than others. Not a single US strategy delivered a significant alpha relative to the four factors listed above. That’s pretty small potatoes coming from the greatest minds in finance over the 20 years since Fama and French’s original paper. If markets are inefficient, more return should be available with less risk and not completely attributable to these simple factors.
We also like to point out that explanatory variables do not necessarily make good investment decisions to begin with. The world does not run on linear regression alone. Common sense should have its place, in particular in the investment world where it can go missing for decades at a time and whole university departments are devoted to its absence.
We need another dimension
So our preferred fifth dimension of smart beta is about as common sense as it gets:
5. Capital preservation.
This requires investors to leave behind the world of mathematical precision and get back to the reality that valuation matters. As simple as it sounds, the benefit of capital preservation is most pronounced in a dynamic multi-period framework, or in the world in which we actually live.
For example, equities as an asset class have terrible timing. They do well when people least need them to and poorly when other calamities tend to arrive, such as job losses and home foreclosures. Reaching for simple equity factor risk premiums can only compound this timing problem, so why make equities worse than they already are?
Cash is of course the ultimate exemplar of capital preservation. In a typical single period investment problem, it is the most boring asset in that it is the only one that offers a completely fixed nominal return. But its very fixed-ness in one period opens up more possibilities over multiple periods, as it offers the possibility to plan in a future that is otherwise unknown.
For example, consider the unfortunate event of an inflation surprise:
Period 1: Inflation surprise, duration and most risk assets are punished, cash holds up well.
Period 2: More capital preserved from holding cash in Period 1 can be reinvested at a higher rate in Period 2.
Boring old cash delivers the triple-whammy: one benefit in Period 1 and two benefits in Period 2. Critically, it delivers these goods precisely when they are needed, not when everything is going swimmingly. So our fifth dimension is really a restatement of the well-known compounding effect, with a little reality check thrown in. In general, as valuation informs risk, defensiveness enables opportunism, and that is the true time-honoured formula to achieve long term investment objectives without crashing and burning in the interim. Smart beta strategies that have no built-in control for valuation risk are susceptible to bouts of extreme overvaluation and risk the permanent impairment of investor capital. For example, what will be the warning signs when a low-volatility smart beta strategy becomes overpriced?
How alternative beta strategies perform
Figure 1 illustrates an interesting capital preservation risk statistic, the maximum recovery period (defined as months taken to recover to the previous high level), among different US-based smart beta strategies and indices since the days of the tech bubble. The next best thing to avoiding capital losses in the first place is to have a reasonable expectation for a quick recovery in value. Please be aware that these do not all represent live track records but also include historically recreated strategies and indices.
As you might expect, style indices fared particularly poorly by this measure. In fact the S&P500 Value index is still in recovery from the GFC and S&P 500 Growth index took more than a decade to recover from the tech wreck.
Figure 1 Maximum Recovery Period, Total Returns in USD, March 2000-June 2013
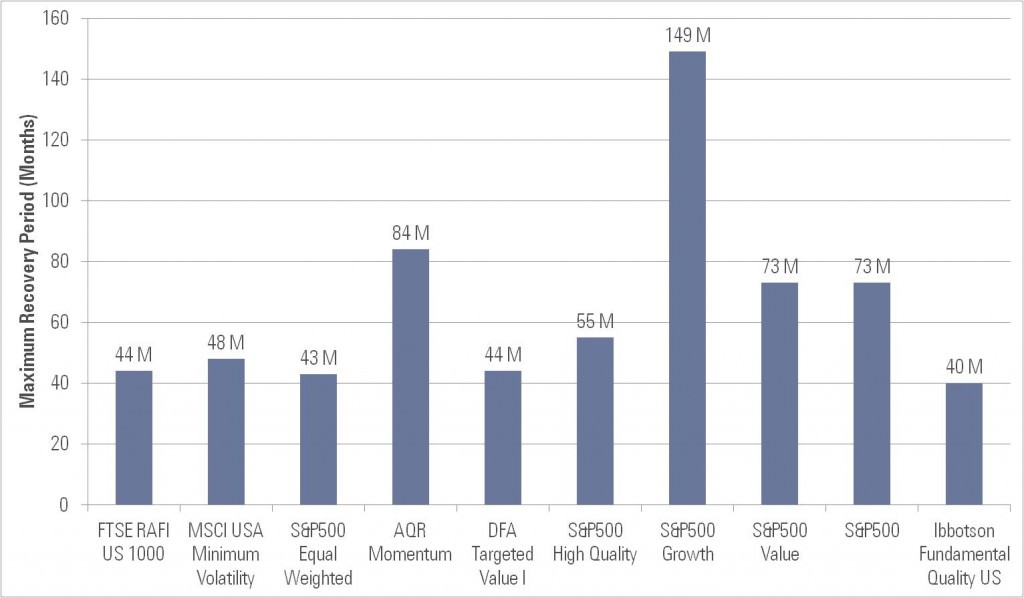
Source: Morningstar Direct, Ibbotson Associates.
Figure 2 shows maximum drawdowns (defined as percentage loss in the value of the portfolio) against annualised total returns over the same time period for the same strategies and indices.
Figure 2 Maximum Drawdowns vs. Annualised Total Returns in USD, March 2000-June 2013
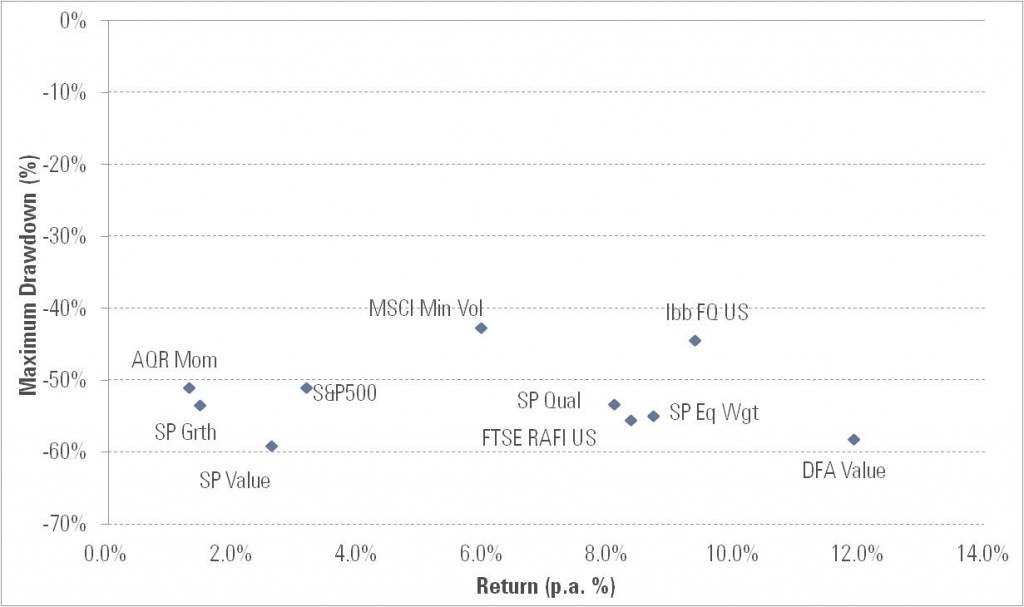
Source: Morningstar Direct, Ibbotson Associates.
In general we hesitate to rely on historical return statistics, whether they are live or simulated, and feel it is safer to focus on maximum drawdown and recovery risk statistics that are not as sensitive to particular starting dates. However, we wanted to show in concept at least the trade off that is potentially available between prospective return and risk as defined in a multi-period capital preservation context. The time period used in Figures 1 and 2 is limited by the shortest history available among the various strategies depicted. Otherwise March 2000 would certainly not have been our first choice for a starting date, since it is right at the peak of the tech bubble and may of course bias the return statistics in particular.
Finally, in Figure 3, in case our previous arguments are not persuasive, we show the Fifth Dimension itself to eliminate any remaining ambiguity.
Figure 3 The Fifth Dimension

Peter Bull is Head of Portfolio Construction at Ibbotson Associates and is also a member of the Morningstar Investment Management Strategic Asset Allocation Committee. Michael Ng is an Investment Analyst at Ibbotson responsible for supporting the investment and implementation capabilities.