At the end of another financial year, this article reviews performance of major investment asset classes over the past few cycles.
The 2019-20 financial year was poor across the board for diversified investors as each of the major asset classes posted lower than historical average returns. ‘Risk’ assets like shares and property were hit by the sharp coronavirus sell-off in February-March 2020, from which most shares and bonds have not yet fully recovered. In the case of ‘defensive’ assets like cash, term deposits and bonds, the low returns for the year were due to ultra-low interest rates in Australia and across the world.
Poor year follows a good run
Bad years happen from time to time, but we need to look at this in context. The calendar years 2012 to 2017 constituted an extraordinary run of six consecutive years of above average real returns from all of the main asset classes - something that had never happened before in history. We said at the time that this could not continue. Calendar 2018 was a negative year thanks to the ‘global growth scare’ in the December quarter, but markets rebounded strongly in 2019 to over-priced levels once again. Something had to give, but what we didn’t know was the trigger, until the coronavirus shut-downs.
The chart below shows total returns (price gains plus reinvested income) for each financial year since 1999-2000 for the broader Australian share market (top chart) as well as the main segments popular with investors – banks, resources, and small companies. The bar to the far right shows the average compound annual total return over the past 20 years.
On the whole, Australian shares posted their worst financial year return since the GFC, just pipping 2011-2012.
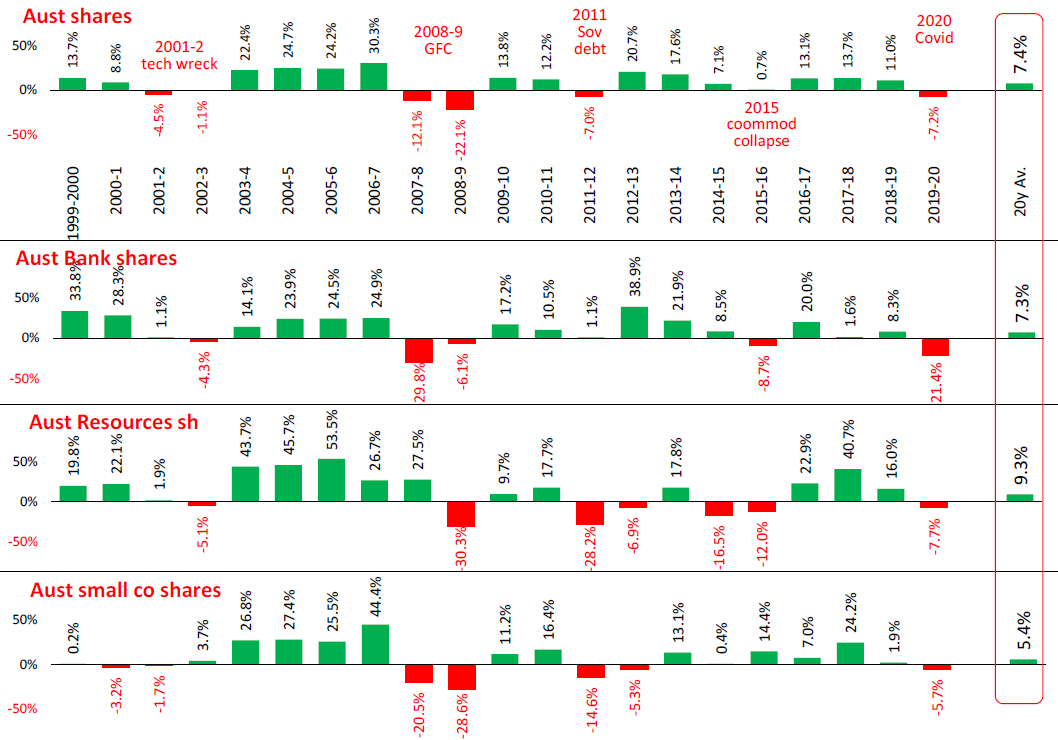
The biggest drag on the market for the latest year was the banks (second chart above). Three of the big four banks were down by one third, with CBA down 16%. Macquarie lost 5%.
The big miners also lagged the broad market but by less than the banks. Fortescue was the star (up +53%) thanks to the surging iron ore price after the mine disasters in Brazil. BHP was down 13% and RIO down 6% on collapsing prices of coal, oil and most industrial metals in the global slowdown. The right bar on the Resources chart shows how they have beaten the banks and also the broad market over 20 years by a margin of +2% per year.
Small companies are speculators’ perennial favourites but they are also perennial disappointments on the whole. This year some small stocks did well, riding the global shift to e-commerce and on online services, which has been accelerated by the coronavirus shutdowns.
The last 12 months has seen a rather mild share market compared to the past two major recession sell-offs – the 2001-2002 ‘tech wreck’ and the 2008-2009 ‘GFC’. Those were very mild economic contractions compared to the current much deeper coronavirus contraction but share prices on both occasions suffered much deeper and longer set-backs than we have seen in the current coronavirus crisis thus far.
Part of the difference is the monetary and fiscal support measures have been much larger and more extensive this time around, but even these extraordinary stimulus measures will probably not be enough to prevent company profits and dividends being cut by as much as they were in the tech wreck and the GFC.
Dividends from Australian shares
The next chart shows returns from the broad Australian share market over the past 60 years, highlighting the sources of total return each calendar year. ‘Total returns’ are a combination of price gains or losses, plus dividend income. The green bars in the lower section show the dividend yield each year and the pink bars show the change in the share price index each year. The price movements (pink bars) are very volatile from year to year. For example, see the -43% price drop in 2008 (GFC) and -32% in 1974 (credit squeeze and property/finance crash).
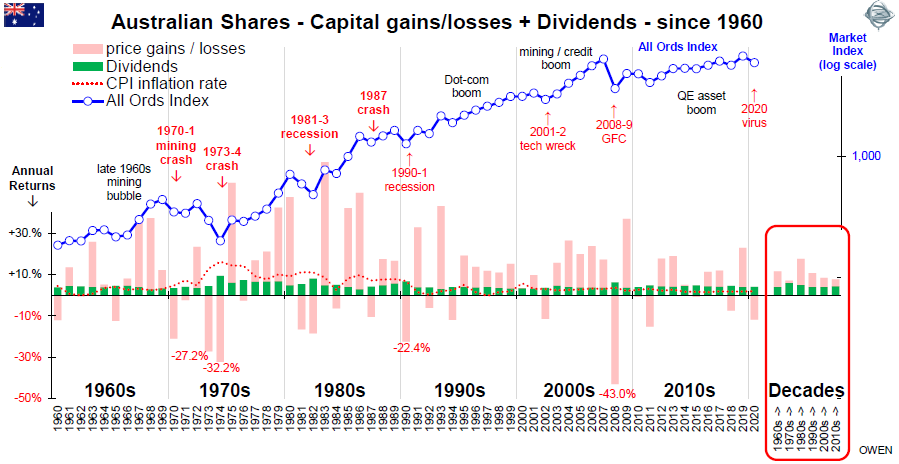
While the wild share price index moves make great media headlines, and they are important for short-term traders and speculators, they are not important for diversified investors unless they have to sell.
For long-term investors, dividends pay the bills, not share price gyrations. The green bars show that the returns from dividend yields from the broad share market have been relatively consistent over time despite inflation (red dotted line) swinging wildly – up to 17% in 1975 and down to 0% and even briefly negative in 1962 and 1997.
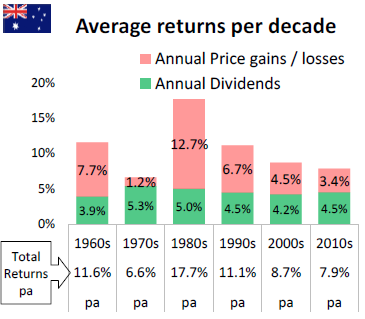 The average returns per decade are highlighted at the right of the above chart, and these are expanded in the chart to the left.
Dividend yields were slightly higher in the 1970s, and that was also when inflation was highest. Yields were higher mainly because share prices were lower (inflation hurts share prices much more than it does dividends). Share prices then recovered strongly in the 1980s but dividend yields remained relatively constant, meaning the dollar amounts of dividends grew along with share prices.
Dividends do vary from year to year of course – companies increase dividends during booms but reduce them in slowdowns and recessions to preserve capital. Aggregate dividends across the Australian market have fallen by around 8% over the past year (mainly from the banks for reasons unrelated to the coronavirus shutdowns) and they are likely to fall by at least that much again as the shutdowns hit profits, but it will probably still leave returns from dividends near 4% over the coming year.
The above charts do not include the benefits of ‘franking’ credits for Australian owners of Australian shares. Franking credits (off-settable against other tax payable) were introduced from July 1987, and then refunds on franking credits were introduced from July 2000. This has added an average of +1.7% to yields since 1987 (it was +1.9% in 2019), bringing ‘grossed-up’ yields to above 6% for Australian residents.
The three big factors lying ahead
There are now three factors in play.
First is the coronavirus itself. The crisis has reminded us that some countries (like the US and Australia) are essentially just loose federations of States which can and do make their own rules and set their own path. This cycle of waves of infections and restrictions may continue until a cure or vaccine is found – perhaps next year. The US is the largest investment market and the most important for global investors, and infection rates there have now re-spiked up to twice the level of the first wave in April.
Second is government spending and borrowing. Formerly capitalist governments everywhere have now turned into welfare states in which they have become lenders, spenders, employers, and owners of last resort to try to directly or indirectly ‘save’ jobs and votes.
Investors will need to keep a close eye on how much governments can borrow before something pricks the confidence bubble. In Australia the Commonwealth was carrying a low debt level of around $50 billion before the GFC. Then to counter the GFC it borrowed an average of $50 billion per year net for next 10 years, taking the level of debt to $560 billion before the virus hit. Since the virus shutdowns, it is now borrowing around $35 billion per month to fund all of the welfare programs.
Third is central banks. Since the GFC, they have become buyers of last resort of government bonds, mortgage bonds, corporate bonds and even shares and property trusts (in the case of Japan). Our own RBA has spent $51 billion buying up government bonds since the March crisis. They say it’s tiny, but it is the same amount as the entire stock of government debt before the GFC.
Meanwhile, in the coming months we will be keeping an eye on the virus numbers, as well as the unemployment numbers and loan arrears rates, and how governments react to them. The big question in the short term in Australia will be whether the government can turn off the welfare taps by September and also lift the ban on evictions and the temporary holidays on residential and commercial rents, and on mortgage repayments.
Magically ending all of these policies smoothly by September without dire consequences will need a miracle.
Ashley Owen is Chief Investment Officer at advisory firm Stanford Brown and The Lunar Group. He is also a Director of Third Link Investment Managers, a fund that supports Australian charities. This article is for general information purposes only and does not consider the circumstances of any individual.