After two solid years of post pandemic dividend growth, it is pleasing to see the trend in Q1 2023, providing great news for retirees.
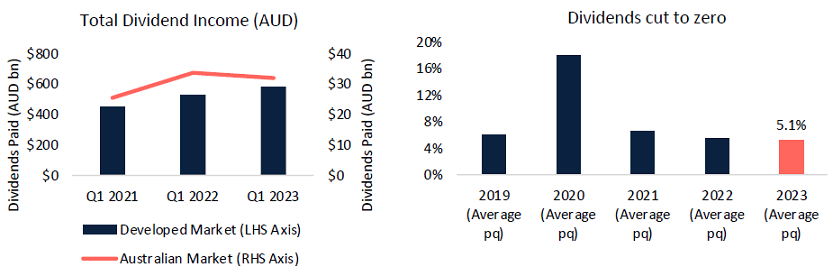
In AUD terms income growth was very strong (+10.1% v Q1 2022). Approximately half of this was due to currency moves, with payouts still growing a solid +5.8% in local currency terms.
Global developed market companies had a strong quarter, paying out $A571 billion of dividends in Q1. Strong payouts continue to mask significant differences across countries and sectors.
Importantly, the number of companies cutting to zero remained low in Q1 (5.1%). This supports our house view of future dividend strength.
The Plato Global Equity fund continues to distribute just under 6% p.a. yield since inception, despite lower index yields in recent years. This highlights the continued importance of both income generation via active management and avoiding dividend traps.
Source: Factset
54% of dividend paying companies increased or initiated dividends compared to the same quarter last year. The number of companies decreasing payouts, has ticked up significantly due to the challenging macro environment, but remains moderate at 12%.
We continue to see some large companies, such as Visa Inc, Costco Wholesale, and Shell Plc, increase their dollar payouts. In addition businesses, like shipping company AP Moller - Maersk, have paid out significant special dividends, a continuing post pandemic feature.
North America and Europe increased quarterly income, in contrast to weakening payouts in Asia, when compared to the previous corresponding period in 2022. (North America +13.1%, Europe +16%, Asia -1.4%)
Which countries are leading the charge?
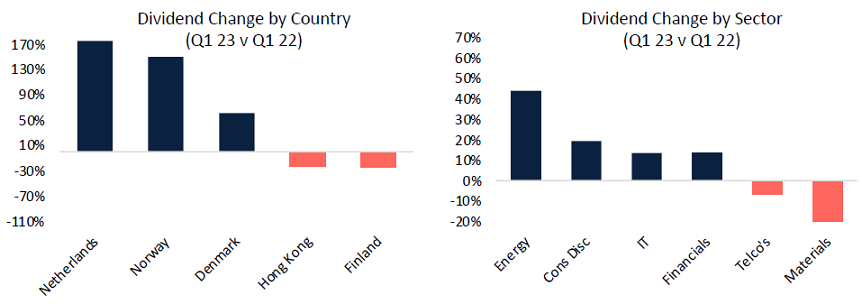
When comparing Q1 2023 with Q1 2022 the story varied significantly within countries. Asian countries ranged from Hong Kong (-23% ) to Singapore (+27%), whilst European countries spanned Finland (-24%) to the Netherlands (+175%).
The US posted strong (+12.5%) dividend growth when based in Aussie dollars. Although not yet a substantial driver, it’s worth noting the US buyback tax did come into effect at the start of Q1.
Despite falling in Q1 (-5.2% v Q1 2022), Australian dividends posted $A32 billion, the fourth highest from a developed country. Despite strong increases from CBA and Woodside, the drop in payout was driven by miners including RIO, BHP, and Fortescue.
Source: Factset
What happened in global sectors through Q4?
Mirroring the trend in countries, sectors were also mixed versus Q1 2022. The stand out increase was once again energy companies (+44%), followed by consumer discretionary (+19.4%). At the other end of the spectrum, materials (-19.9%) payouts fell the most, with telco’s (-6.5%) also cutting significantly.
The drivers of yield, energy and consumer discretionary, continue to be consistent from 2022.
This is similar to the domestic landscape, where big miners are cutting in contrast to energy companies who are lifting dividends to reflect surging gas prices. After a stellar 2022 energy stock prices underperformed in Q1, but strong dividends reflect the balance sheets from the earlier commodity rally. Increased payouts were seen from businesses in the sector, including Equinor and Japan Petroleum Exploration. Co. In contrast materials businesses, for example Rio Tinto and BHP, cut.
Consumer discretionary yield strengthened further, driven by surprisingly strong household balance sheets. In 2023 the sector has overcome cost of living pressures, posting strong stock price return. Many Japanese companies in the sector, like Fast Retailing Co and Suzuki Motor Corp, grew their distributions in the most recent quarter.
Interesting facts in global income
When incorporating dividend cuts and initiations, 3.4 companies increased or initiated dividends for every one company that reduced or completely cut dividends versus the previous corresponding period. This is further proof of dividends continuing to strengthen.
46% of US companies paid a dividend in Q1. Strong ratios were also evident in Japan (72%), Canada (65%) and Australia (52%).
What’s the outlook for global income?
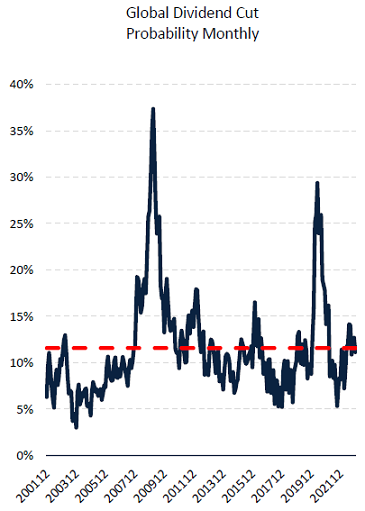
Plato’s proprietary dividend cut model provides insights into future dividends. It represents Plato’s macro view regarding the likelihood that global developed markets will cut their income.
Our model predicts a low probability of global developed market dividends being cut (12%). Q1 is slightly higher than a year ago, which reflects the increasing concern around inflation and global growth. The risk to income remains around the long-term average and continues to indicate a positive outlook for retiree income.
Real Estate and telcos are the highest risk industry groups, the former continuing to reflect the cost of living crisis.
In conclusion
After 2020 pandemic driven cuts to global market income it is important to see two years of strong growth, albeit from a low base. Global equity markets have continued this trend in Q1 2023, reflected in strong headline numbers. But, this masks divergence within sectors, highlighting the importance of vigilance and active management in income generation.
As we look forwards, the low probability of dividend cuts paints a strong dividend picture for yield investors.
Methodology
- The methodology uses dividends paid, in AUD, however the ex dividend date is used to allocate the dividends in the relevant time period e.g. Q3 2020.
- Dividend paid ($) for each stock in each calendar quarter is calculated as the shares outstanding as of quarter end multiplied by the total gross dividend per share (DPS) paid out in the calendar quarter. The DPS paid excludes spin offs but includes capital returns and special dividends. Conversion to AUD is done using the prevailing WM/Reuters London exchange rates at the time of dividend payment.
- Full year dividend paid ($) is the summation of dividend paid ($) from Q1 to Q4 using the methodology (1).
- DPS movement is based on total DPS paid out (in local currencies) over each calendar quarter. DPS movement from quarter to quarter is then categorised as initiating, increasing, unchanged, decreasing or cut to zero.
- Secondary issues are removed from the calculations to prevent double counting of income.
Daniel Pennell is a Senior Portfolio Manager with Plato Investment Management. Plato is affiliated with Pinnacle Investment Management, a sponsor of Firstlinks. This article is for general information only and does not consider the investment objectives, financial situation or particular needs of any investor.
For more articles and papers from Pinnacle and its affiliates, click here.