The wealth profile of Australian households has changed phenomenally over the past 25 years, according to a recent paper from the Australian Centre for Financial Studies. Thanks to increases in asset prices and the introduction of compulsory superannuation in 1992, most households are much wealthier than those of previous generations. Total household wealth in 2013 reached A$6,689 billion, six-and-a-half times the level of household wealth in 1988.
From an aggregate point of view, as RBA data shows below, the net wealth trend line has been positive and increasing with one noticeable blip – the global financial crisis in 2007-08.
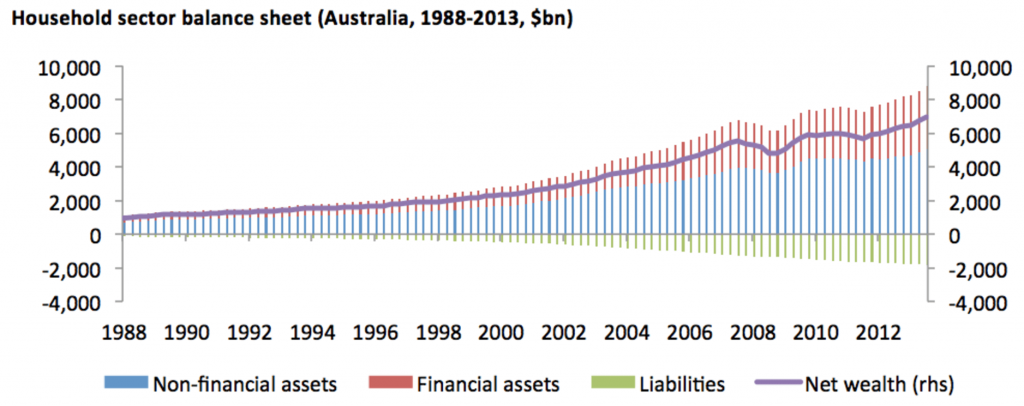
As of the end of 2013, dwellings comprise more than half the value of household assets (54%); superannuation and life policies account for a further 25%; with consumer durables (such as motor vehicles and household furnishings) at 3%. This provides an interesting contrast with 1988, where again dwellings accounted for around half the value of household assets (51%); superannuation and life policies 17%; and consumer durables 10%.
While the value of assets has gone up, so too has household debt. In 2013, total household liabilities, mostly debt, stand at around half (49%) of the value of household financial assets, or around one-fifth (21%) of total assets. So, for every dollar in debt, households have, on average, about $2 in financial assets and around $5 in total assets.
This compares to the situation in 1988, when total household liabilities stood at around one-third (33%) of the value of household financial assets, or around one-eighth (13%) of total assets. In 1988, for every dollar in debt, households had, on average, about $3 in financial assets and around $8 in total assets.
By age and income
While overall household wealth is increasing, there are some very marked variations when the data is segmented by age and income levels.
An examination of net wealth by age group reveals a lifecycle pattern to consumption. This is well expressed by the figure below, which provides an excellent stylised view of the use of financial assets as a means of smoothing consumption through the lifecycle.
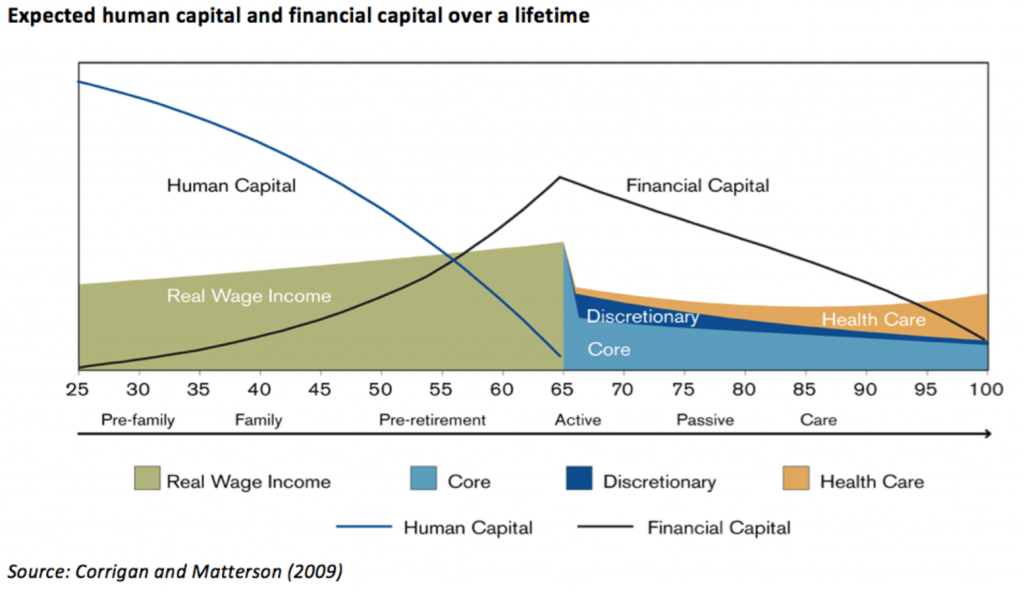
Assets are accumulated through the use of human capital from the beginning of a working life. Debt is used to supplement income to further finance assets, which is then paid down pre-retirement. Net wealth is then expended in retirement.
In retirement, the capacity for an individual to support oneself through human capital is much reduced. Therefore, households need to ensure sufficient financial resources have been accumulated for consumption for discretionary purposes – especially in the more active early retirement phase – and to cover the potential increase in health-care costs in the later stages of retirement.
Just as Australians have been consolidating their wealth, a second major trend has been the rise in longevity. Life expectancy for men has risen from around 65 in the early 1900s to around 85 today. While increased wealth bodes well for financial well-being in retirement, steps must be taken to preserve and protect retirement savings to last for what can be around 20 years on average, after the completion of working life.
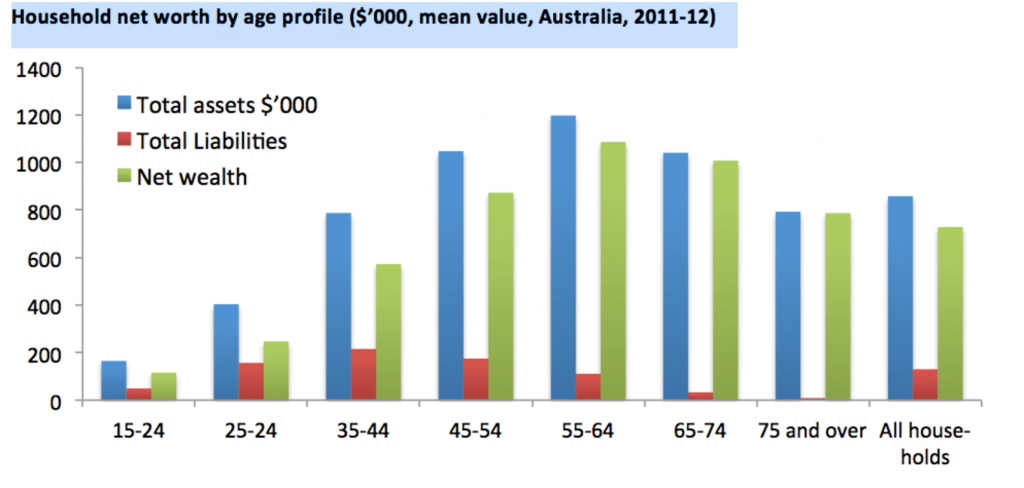
Household net worth by age profile ($’000, mean value, Australia, 2011-12). Reserve Bank of Australia, 2013.
A skewed distribution of net wealth
Within a defined contribution superannuation system, the need for both advice and products to assist consumers to manage investment and longevity risk to ensure a comfortable and self-reliant retirement is a priority.
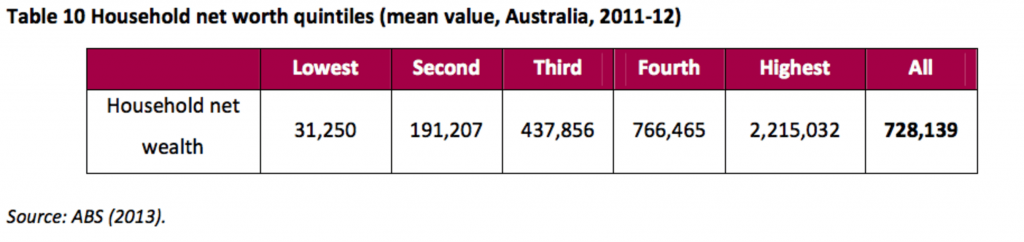
However, for some households, managing wealth is not an issue. Australia, as in many OECD countries, has a skewed distribution of net wealth, with the bulk being held by a relatively small number of households. The wealthiest 20% of households hold around 61% of total household net worth, averaging $2.2 million per household.
On the other hand, the poorest 20% of households account for just 1% of total household net worth in Australia, with an average of about $31,000 per household. Mean household net worth in Australia for the period 2011-12 was around $728,000 (consisting of $858,000 assets and $130,000 of liabilities).
So not everyone in Australia is getting wealthier. Many households face financial exclusion where:
Individuals lack access to appropriate and affordable financial services and products - the key services and products are a transaction account, general insurance and a moderate amount of credit.
A 2013 Australian study found that 18% of the adult population were either fully excluded or severely excluded from financial services in 2012. Just over 1% of adults were fully excluded – they had no financial services products – and almost 17% of adults were severely excluded in that they only had one financial services product.
In all, this means more than three million Australians are either partly or fully financially excluded.
What do Australians need from financial services?
Despite the fact that Australians are getting wealthier, financial literacy is not increasing at the same rate. There is a gulf between what households actually do and what may be in their best interests to do. The complexity of the problem means that households need assistance in making these decisions.
The need for guidance is so critical that it must be available in multiple forms. In addition to traditional financial advice, embedded product and/or technology-based guidance may help nudge households toward better decisions.
Households are also exposed to a multitude of financial-related risks – market inflation, longevity, health, leverage and climate risks to name a few – which are simultaneously dynamic, complex and can manifest over different time horizons. In addition to improved guidance, households need a more complete menu of solutions to help manage these risks.
To make this guidance and risk management as effective as possible for households, they require a complete set of financial “building blocks”. Without these, some household risks loom large: for example, longevity risk remains a real consideration for households, increasingly so as the population ages.
Furthermore, there is an implicit assumption that all Australians have equal access to, and benefit equally from, the financial system. This is not the case. Large segments of the population suffer from financial exclusion: they have either limited or incomplete engagement with critical channels of the system. Measures specifically targeted at closing these gaps should be a priority.
Finally, to facilitate the innovation required to meet these challenges, regulation must be flexible, responsive and oriented towards meeting the needs of households. One immediate reform would be to promote further innovation in the area of retirement income products.
Building a financial system that serves Australian households requires a range of approaches if we are to build an inclusive and more equitable society.
Deborah Ralston is Professor of Finance and Director at Australian Centre for Financial Studies. Deborah does not work for, consult to, own shares in or receive funding from any company or organisation that would benefit from this article, and has no relevant affiliations. This article originally appeared in The Conversation.
