I have written many times about why fears about ageing are misplaced.
For starters, we have panicked about it for a century.
Also, the reality is that we aren’t adding extra old years at the end of life. Instead, we are stretching out our entire lives. We work to older ages, but start work later, too. Women work a larger share of their lives. Here’s my take on this important but misunderstood pattern of stretched-out lives.
It is a little strange that few people notice this. It should be obvious. It is extremely clear in the data. I can only surmise that ageing is something that can be transformed into a crisis and promoted to justify self-interested policy positions.
Which is weird when you think about it.
We have spent the past century devoting a huge amount of social resources to the science of medicine with the intention of making people live longer. That is what ageing is, after all. And I never hear that we should curtail medical investment and innovation because of the cost of ageing it creates.
Another part of ageing is the baby-boomer bulge.
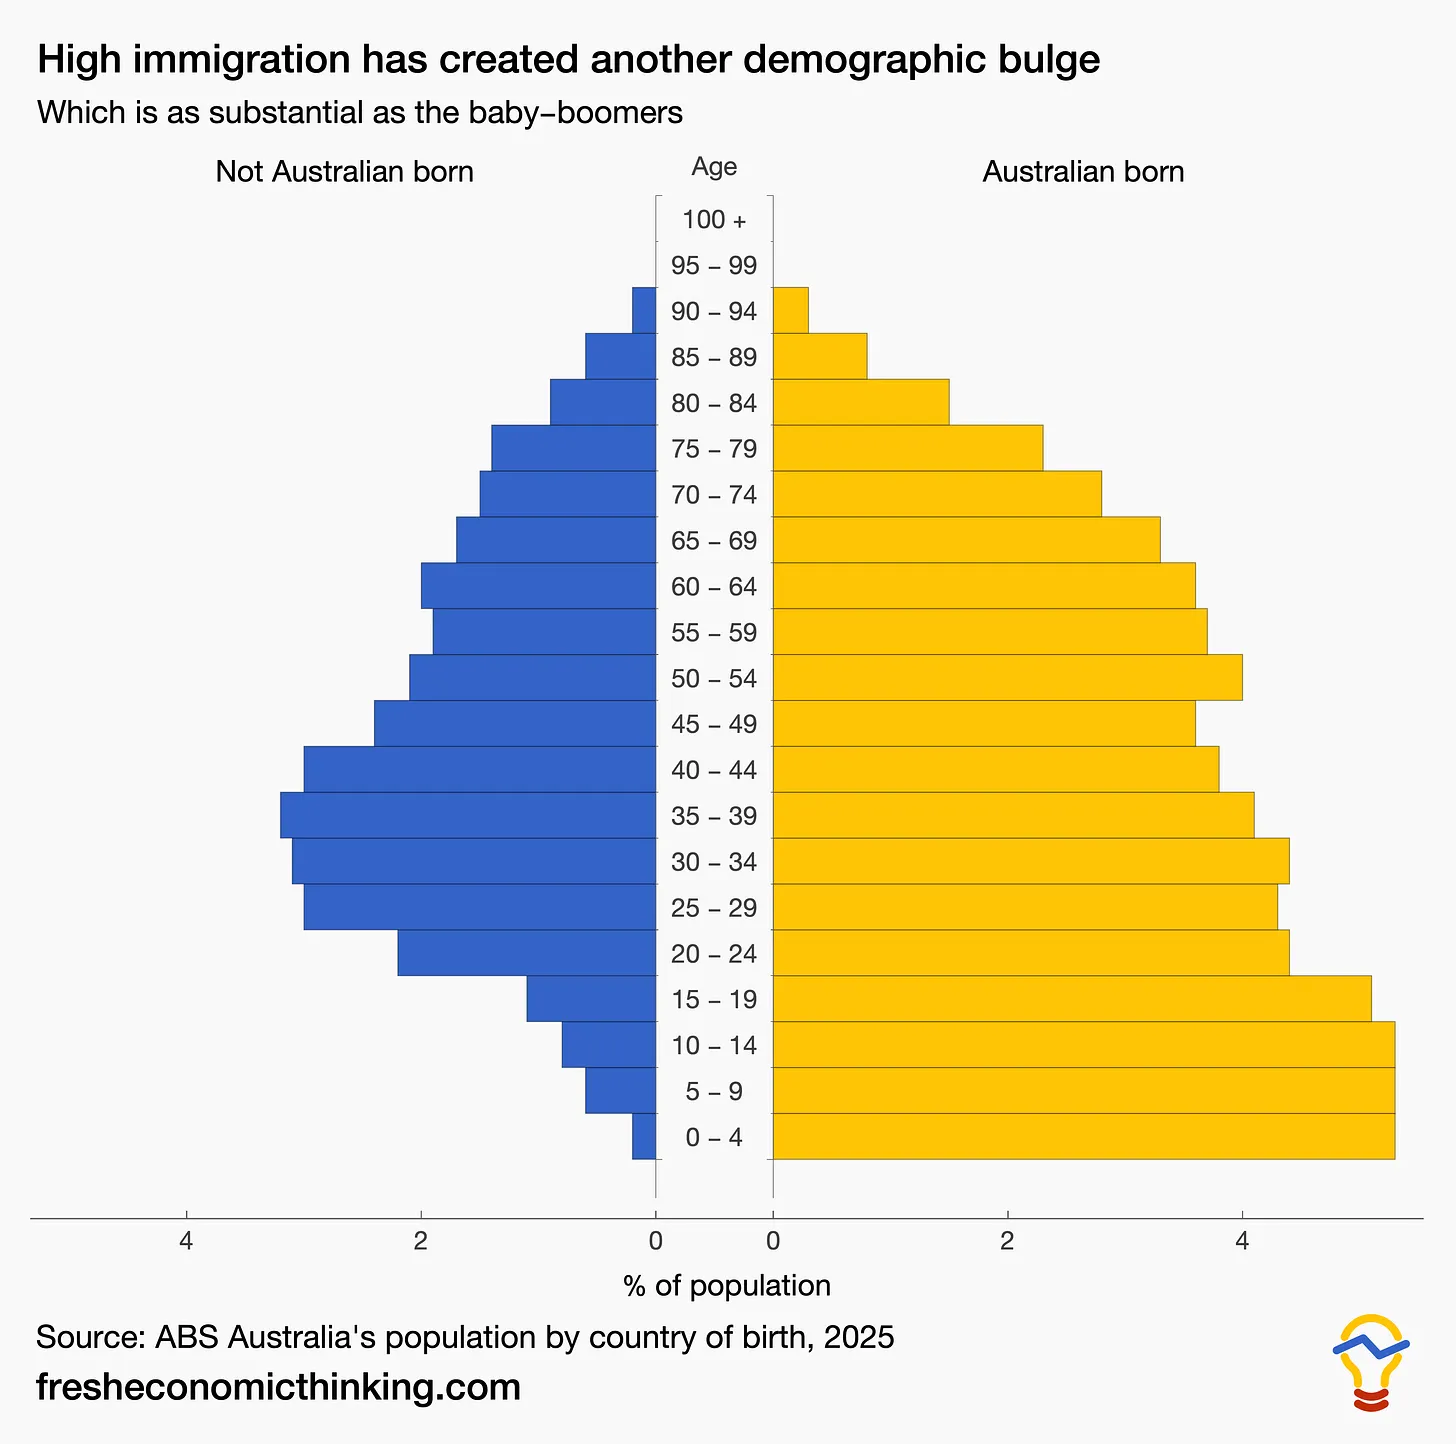
The odd thing about the boomers is that we know their demographic bulge is temporary and their ageing inevitable, and there is essentially nothing that can be done about it. Many people like to argue that immigration will solve it, but this is simply not true. Immigrants age at the same rate as the rest of us, and now we have a bulge in the age profile where most immigrants arrive, creating the same “pig in the python” bulge that will age just like the baby boomers.
That is clear from the image below.
The mistaken ageing crisis script goes like this.
Look at changes to the population age structure and simply assume that it is bad and creates more non-working dependents who rely on others for their income, either from others in their household, or the state via pensions.
Take a look at the chart below.
In it, I compare the trends for the past 35 years of two measures.
First, age dependency, which is a characteristic of the age profile of the nation. Nothing more. Nothing about who is working or how much, nor who is dependent on whom.
There are many ways to measure it, but here age dependency is the number of people aged 14 and below plus those aged 65 and above, divided by the population aged 15-64. So when the measure is 50%, it means there are two people aged 15-64 for every one person outside that age range. When it is 70%, like it has been in Japan recently, it means there are only 1.42 people in the 15-64 range for every one person outside that range. At 100%, it would mean one person aged 15-64 for every one person aged outside this range.
The second measure is economic dependency. This is the actual workforce divided by the population (including both full- and part-time workers). There are no age limits on working, so why not look at who is actually working?
Here, I have measured economic dependency as the total number of non-workers (the population minus the labour force) divided by the population. So when the measure is 50%, it means that there is one worker for every one non-worker. When it is 40%, it means that there is one worker for every 0.67 non-workers.
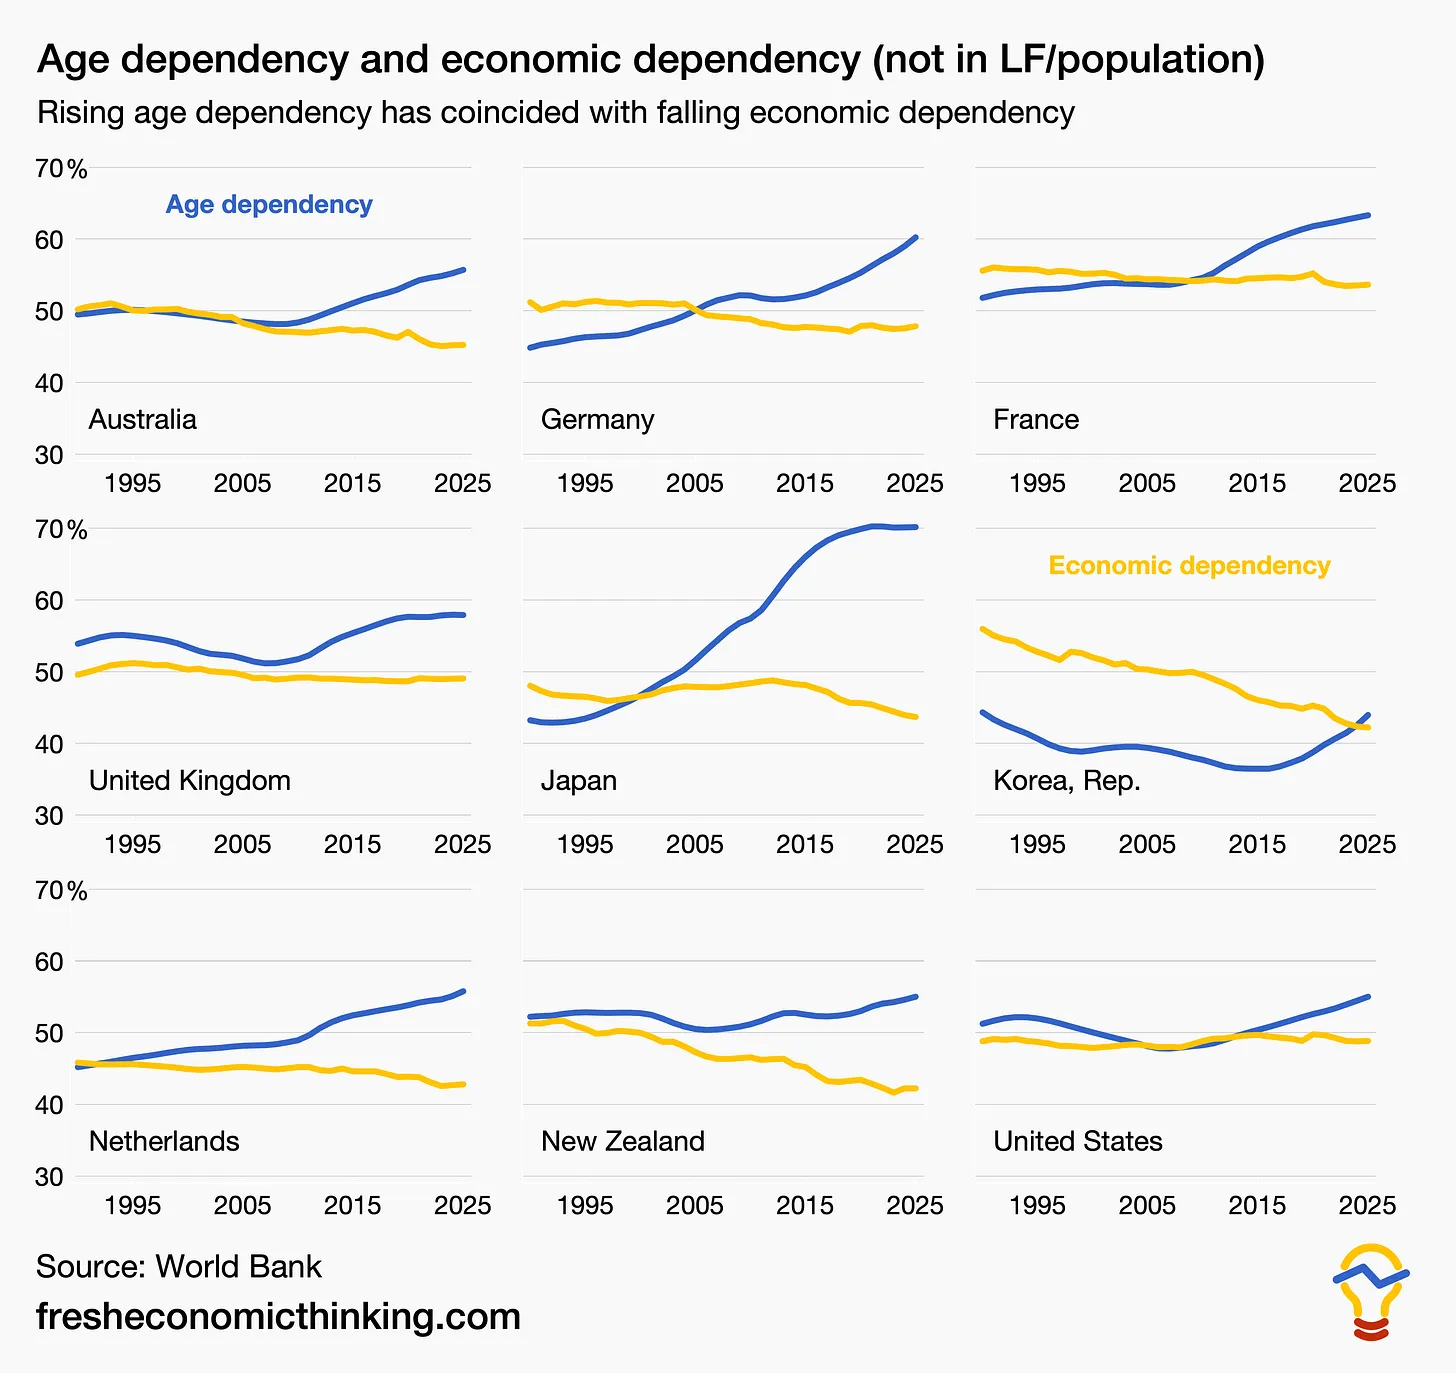
Notice that in all of these countries, age dependency has been rising, especially in the past 10-20 years.
But in all of them, economic dependency is falling. Often quite substantially.
This is true even in countries like Japan, which have both an ageing and declining population.
This pattern of declining economic dependency despite rising age dependency is because of our stretched-out lives. We work later but longer. Looking at ratios of people in fixed age brackets was always silly.
The working later but longer pattern is evident in Australia in the charts below, which include a breakdown of the full- and part-time share of the population for key age groups.
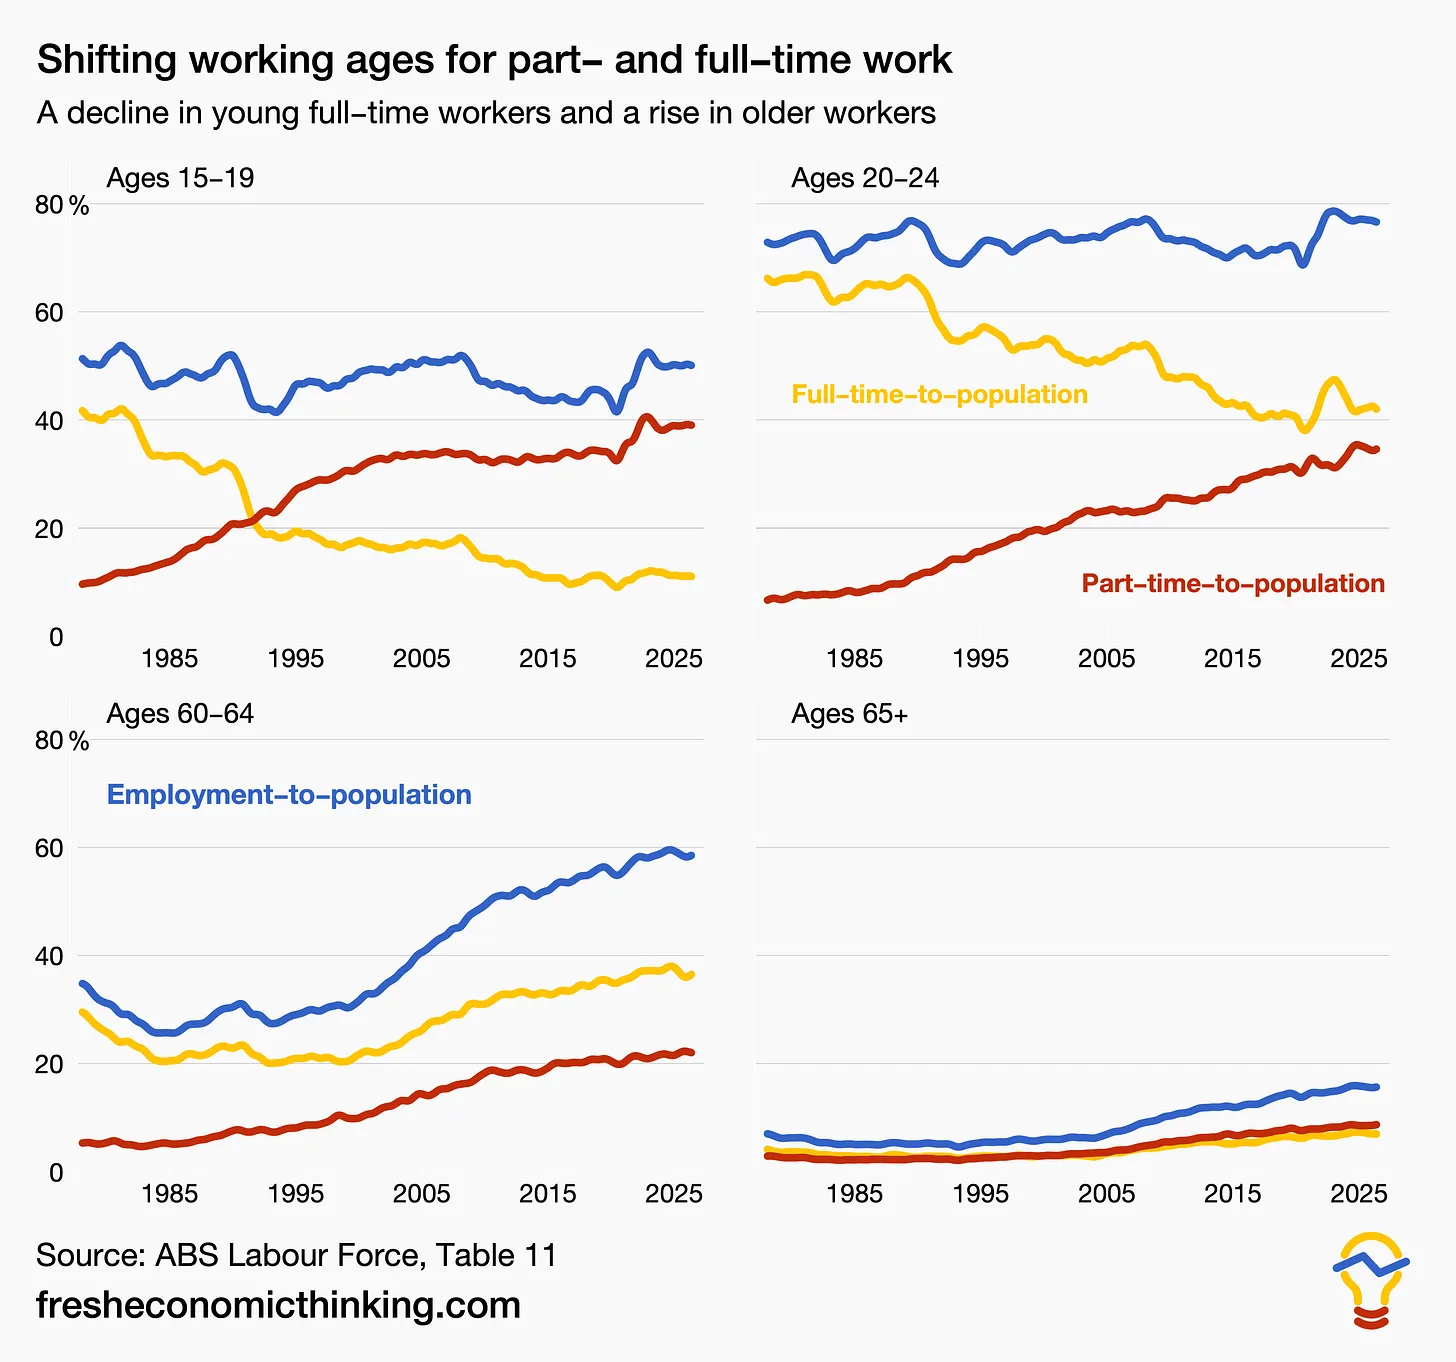
Across the top are the 15-19 and 20-24 age groups. Notice that although total workforce participation remains stable, there has been a major switch from full-time to part-time work. This is generally associated with people studying longer rather than commencing full-time work in their late teens. So overall, less work from the young.
But look at the bottom two charts.
Since the 1990s, the share of 60-64 year olds working has doubled, from 30% to 60%. Meanwhile, the share of the population at this age has increased from 4.2% to 5.6% since 2000. This older age group is working much more and growing as a proportion of the population.
Back in the 1980s, people aged 20-24 worked full-time at triple the rate of those aged 60-64 (66% compared to 22%). Now, both age groups see about 40% of people working full-time, while the younger group has higher overall participation via more casual and part-time work.
Looking older still, the share of those over 65 working has tripled from 5% to 15% over the same period. Their share of the population has grown from 11% to 14% since 2000.
We are the oldest we have ever been on average.
Has the sky fallen?
Nope.
Ageing has been a huge success. We live longer, healthier lives, and we spend them becoming more educated and working later but longer.
Any claim that is backed by the need to “do something” about the ageing crisis should be carefully scrutinised, because there is no such thing.
Dr Cameron K. Murray is Chief Economist at Fresh Economic Thinking. The original article can be found here. Subscribe to his written work at Fresheconomicthinking.substack.com or YouTube channel @fresheconomicthinking. This article is for general information.