As Warren Buffett would say, “price is what you pay, value is what you get”.
For investors, the case for paying more to invest in an actively managed fund is that it should deliver additional value worth having. The SPIVA Australia Scorecard, published every six months, puts this proposition to the test. Its latest edition has reinforced a familiar and long-standing trend – for the most part, active funds struggle to beat the benchmark.
In the first half of 2026, nearly 78% of active Australian large-cap equity funds trailed the S&P/ASX 200. The average fund returned a paltry 0.2%, compared with a modest 2.4% for the index. More effort, judgement and expense did not produce a better average result, even when the benchmark itself delivered little to celebrate.
That does not mean the cheapest index fund wins by default. Even the three largest broad Australian share ETFs track different benchmarks, so what appears to be the same exposure can produce different portfolios and returns. In our view, the more useful debate is not active versus passive, but whether a strategy delivers the outcomes that investors seek over time.
The price of skill
A higher management fee may be justified when a fund delivers strong results and repeats them across different market conditions.
But the numbers show that over 15 years, 89% of active Australian large-cap funds have underperformed the S&P/ASX 200, while less than half the funds operating at the start of 2011 are still around today.
Chart 1: Percentage of underperforming active Australian funds
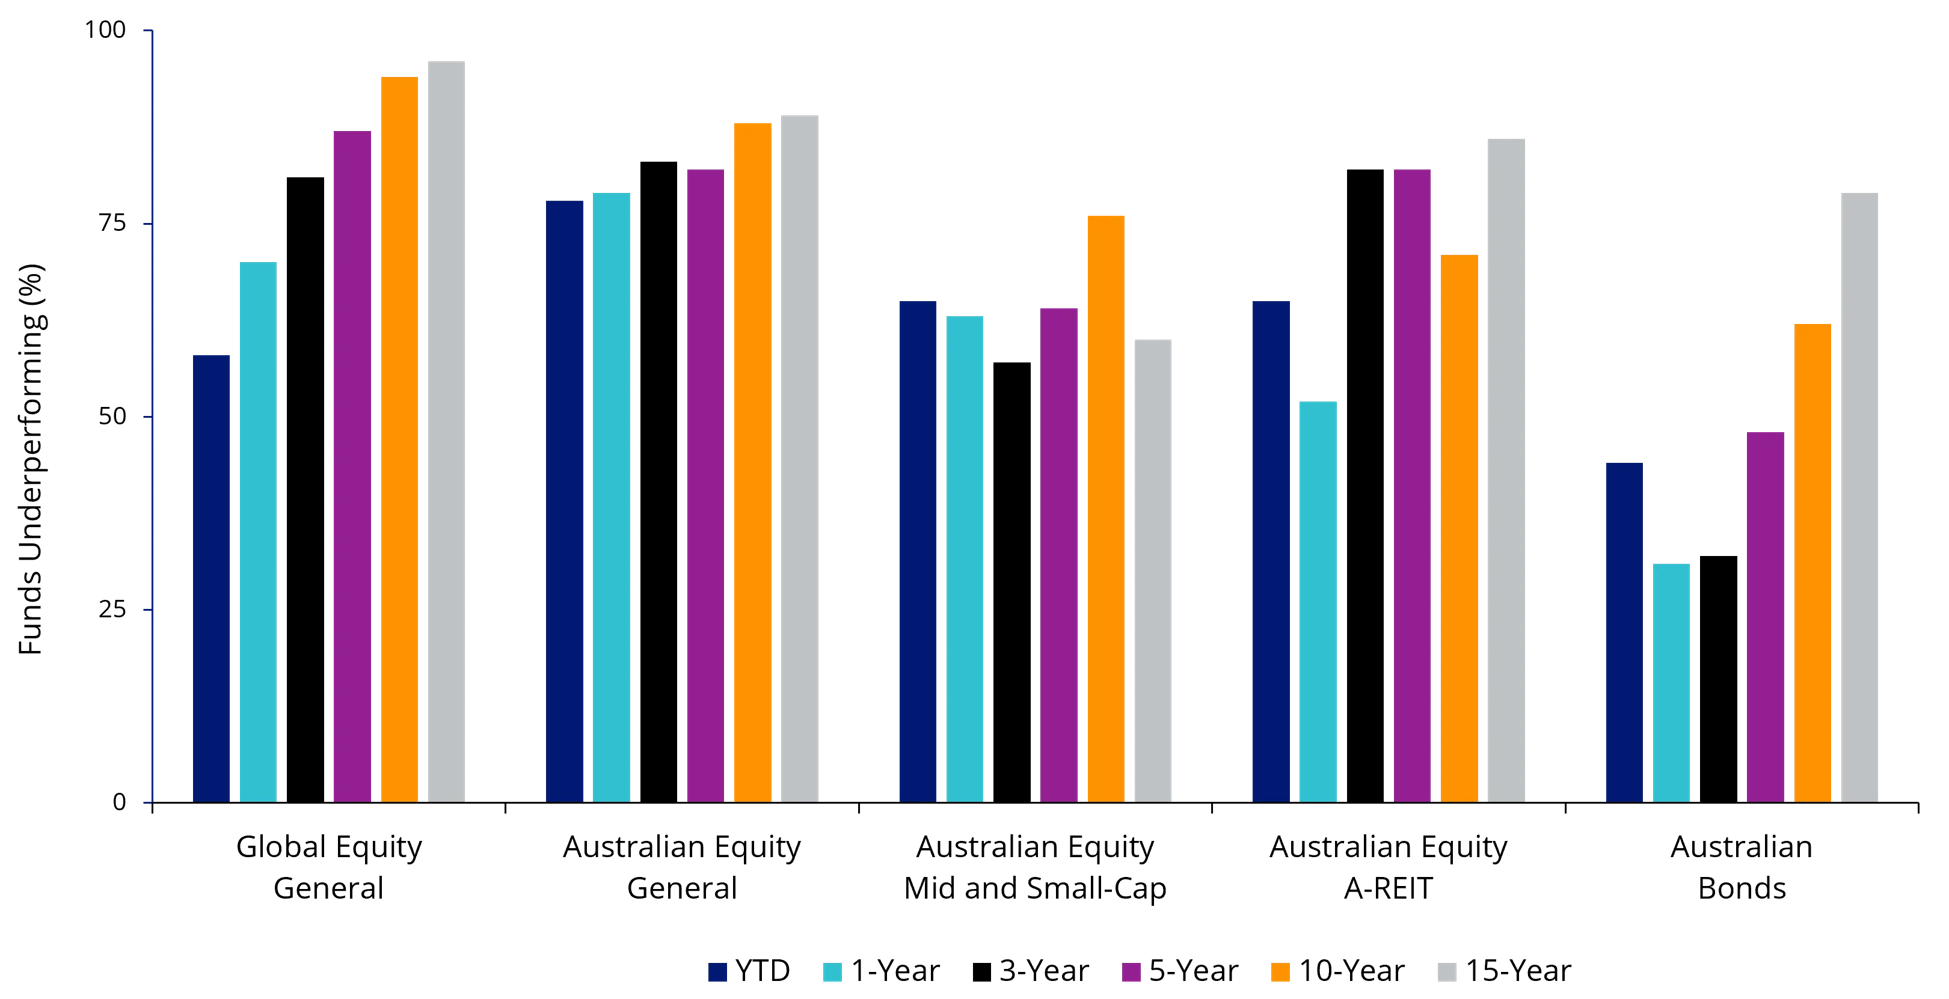
Source: S&P Dow Jones Indices LLC, Morningstar. Data as of June 30, 2026. The S&P World Index (AUD) was launched May 28, 2020. The S&P/ASX Mid-Small was launched July 29, 2011. The S&P/ASX Australian Fixed Interest 0+ Index (Legacy) was launched Feb. 13, 2025. All data prior to such date is back-tested hypothetical data. Past performance is no not indicative of future results. Chart is provided for illustrative purposes and reflects hypothetical historical performance.
SPIVA’s approach makes those figures hard to dismiss. Fund returns are measured after fees, while the analysis starts with every fund available at the beginning of the period, including those that later close or merge. This prevents the results from being flattered by examining the survivors alone.
The benchmark has a price too
The failure of so many active funds does not make the conventional index a flawless alternative. During the first half, the combined weight of the 20 largest companies in the S&P/ASX 200 rose from 61% to 63.4%, while just 35% of its constituents outperformed the index. Investors captured the benchmark return, but almost two-thirds of their exposure was concentrated in 20 companies.
Chart 2: S&P/ASX 200 top 20 constituent weight
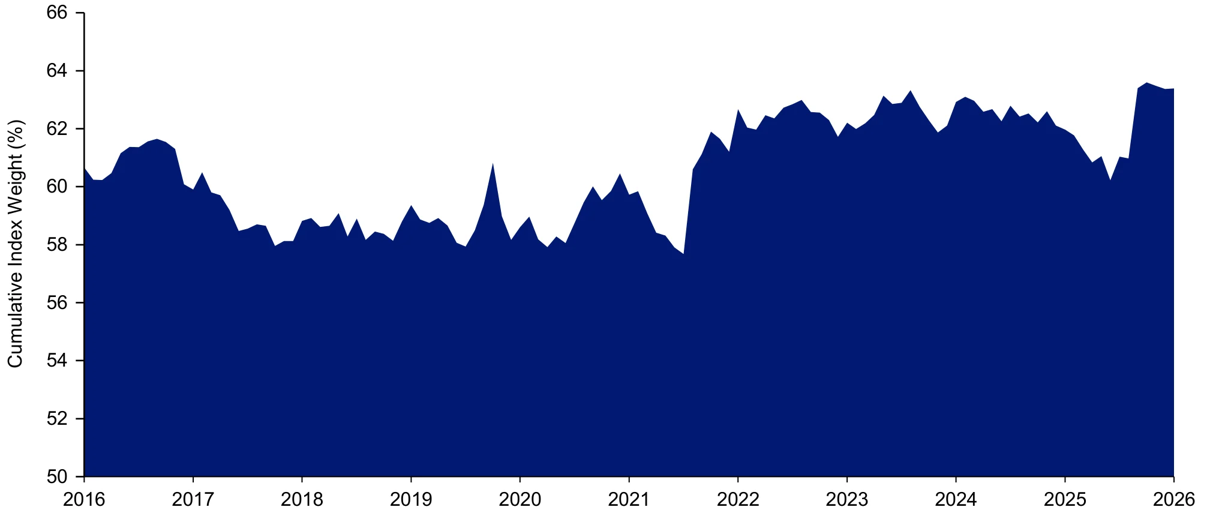
Source: S&P Dow Jones Indices LLC. Data as of June 30, 2026. Past performance is not indicative of future results. Chart is provided for illustrative purposes.
We have written about this subject many times, including an entire white paper which you can read here.
The third option has a track record
Smart beta offers a third option. It is systematic and transparent like conventional index investing but uses predetermined factors or portfolio-construction rules rather than weighting companies by size alone.
The VanEck Australian Equal Weight ETF (MVW) applies this approach to the largest and most liquid companies on ASX, giving each the same weight at every rebalance. This reduces the portfolio’s dependence on market giants whose past share price gains have increased their influence over the benchmark.
The results provide the value test. MVW has outperformed the average active Australian large-cap fund over every comparable period to 30 June 2026:
|
Period
|
MVW net return
|
Average active fund
|
Difference
|
|
1 year
|
3.02%
|
2.31%
|
+0.71%
|
|
3 years p.a.
|
8.29%
|
7.88%
|
+0.41%
|
|
5 years p.a.
|
7.21%
|
5.97%
|
+1.24%
|
|
10 years p.a.
|
8.93%
|
7.95%
|
+0.98%
|
Source: S&P Dow Jones Indices LLC, Morningstar, VanEck. Data as at 30 June 2026. Average active fund returns are equal-weighted. MVW results are net of management fees and costs incurred in the fund but exclude brokerage costs and buy/sell spreads. Past performance is not indicative of future performance.
Like any other investment, smart beta does not remove risk or guarantee outperformance. Equal weighting can lag when large companies lead and MVW holds fewer companies with different sector allocations from the S&P/ASX 200.
But those differences are also the point: MVW offers a more balanced way to own Australian shares and has been offering just that for more than 12 years.
Smaller companies, same long-term problem
Smaller companies are often held up as the natural hunting ground for active managers. They attract less research and an informed stock picker may have more room to uncover value. By SPIVA’s measure, there is something to that case.
Over 15 years, 60% of active Australian mid- and small-cap funds underperformed their benchmark. That was better than the 79% of Australian bond funds and 96% of global equity funds but still left a clear majority failing to beat the market.
There is also an important caveat for investors to think about. SPIVA puts mid- and small-cap funds in the same bucket. This is because some small-cap funds also hold substantial positions in mid-sized businesses. Their mandates may allow this, but the name alone may not give investors a complete picture of what they own.
That distinction mattered during the first half of 2026. The S&P/ASX MidCap 50 fell 4.0%, while the S&P/ASX Small Ordinaries lost 7.9%. A small-cap fund holding mid-caps could therefore appear to have made better stock selections when part of its advantage came from owning companies that investors may not expect to find in a small-cap portfolio.
The VanEck S&P/ASX MidCap ETF (MVE), on the other hand, makes its investment universe explicit by tracking the S&P/ASX MidCap 50 Index. MVE outperformed the blended active cohort over six and 12 months, although part of that advantage reflected the stronger performance of mid-caps. That distinction illustrates why investors should look under the hood and understand which part of the market they own.
Why pay more?
Sometimes there is a good answer. A skilled manager can earn their fee, while a smarter index can improve on the conventional benchmark. But the label alone says little about value. Investors should consider what they own, how their returns are produced and whether the results justify the cost. SPIVA’s latest scorecard reinforces the lesson of its long-term record: value is measured in outcomes, not effort.
Key risks
An investment in MVW or MVE carries risks associated with financial markets, individual company management, industry sectors, fund operations and tracking an index. MVE also has greater exposure to mid-sized companies and a narrower part of the Australian sharemarket. See the applicable PDS and TMD for details.
MVW is likely to be appropriate for investors seeking capital growth and regular income distributions, intending to use the fund as a core, minor or satellite allocation, with an investment timeframe of at least five years and a high risk and return profile.
MVE is likely to be appropriate for investors seeking capital growth and regular income distributions, intending to use the fund as a minor or satellite allocation, with an investment timeframe of at least five years and a high risk and return profile.
Russel Chesler is Head of Investments and Capital Markets at VanEck, a sponsor of Firstlinks. An actuary with over 30 years’ experience in financial services, Russel is responsible for managing VanEck's passive solutions.
For more articles and papers from VanEck, please click here.
Any views expressed are opinions of the author at the time of writing and is not a recommendation to act.
VanEck Investments Limited (ACN 146 596 116 AFSL 416755) (VanEck) is the issuer and responsible entity of all VanEck exchange traded funds (Funds) trading on the ASX. This information is general in nature and not personal advice, it does not take into account any person’s financial objectives, situation or needs. You should consider whether or not an investment in any Fund is appropriate for you. Investments in a Fund involve risks associated with financial markets. These risks vary depending on a Fund’s investment objective. Refer to the applicable product disclosure statement (PDS) and target market determination (TMD) available at vaneck.com.au for more details. Investment returns and capital are not guaranteed.