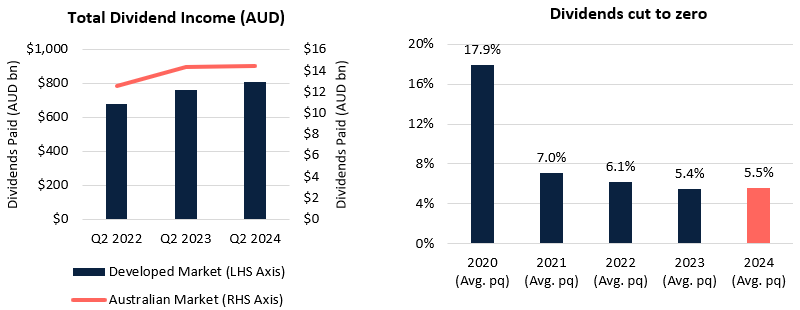
Q2 continued the positive trend, providing great news for retirees invested globally for income. Global markets are up nearly +15% YTD (MSCI World in AUD), and although Q2 was relatively flat with respect to total return, there was +6.5% (in AUD terms) dividend growth.
When comparing Q2 2024 to Q2 2023, dividends grew +6.3% in local currency terms, with only a marginal boost to +6.5% when revalued in AUD.
Global developed market companies had a strong quarter, paying out A$807 billion of dividends.
The number of companies cutting to zero remained low in Q2 (5.4%). This supports our ongoing view of continued dividend strength from global equities.
Source: Factset
Over half, 56.8%, of dividend paying companies increased or initiated dividends when compared to the same quarter last year. The number of companies decreasing payouts remained relatively constant, at 10.6%.
We continue to see large companies, for example Nestle, LVMH Moet Hennessy Louis Vuitton and Microsoft increase their dividends per share and distribute large dollar payouts. In addition, businesses that omitted dividends in the pandemic and tentatively paid special dividends, are now back to regular distributions. One example is HSBC holdings, who in addition to the now regular dividend paid a special dividend given the completed sale of their Canadian business to RBC.
Two of the three regions increased income, in AUD terms, when comparing Q2 to the previous corresponding period in 2023. (North America +5.4%, Europe +9.1%, Asia -4.8%).
Which countries are leading the charge?
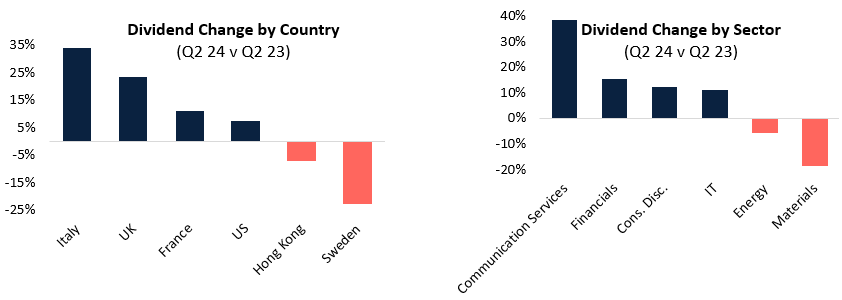
Q2 is traditionally when many large single dividends are paid in Europe. Europe was responsible for over half of the income in the most recent quarter, with over 30% from Germany, France and the UK alone. When comparing Q2 2024 with Q2 2023 we saw strong growth in many countries, including Italy (34%), UK (+23%) and France (+11%). This was partially offset by cuts in Sweden (-23%) and Finland (-22%).
The US grew dividends over +7% and paid 34% of the overall quarterly income payout.
Australia remained a strong dividend payer, with a small (+1%) growth in dividends, when comparing Q2 2024 with the corresponding period last year. There were significant payouts from the major banks, Westpac (including a special dividend), NAB and ANZ, backed up by large percentage increases in the dividend payouts of Aristocrat Leisure and Stockland.
Source: Factset
What happened in global sectors?
There was considerable difference in sector payouts. Communication services (+38%) led the charge, followed by increases from Financials (+15%), Consumer Discretionary (+12%) and IT (+11%).
Whilst growth sector dividends reflected strong market returns, more defensive sectors, who have had weaker total return, had softer payouts (Real Estate +0%, Utilities -1.5%).
Communication services got a substantial boost from large businesses that initiated dividend payments in 2024 (Alphabet and Meta), reflecting strong company performance and solid balance sheets.
Discretionary companies increased payout, despite rampant cost of living pressures globally. The most significant payouts came from auto and luxury companies, that included Mercedes Benz, Stellantis, Volkswagen, LVMH and Hermes. Although significant in dollar terms BMW decreased dividends per share, due to falling net profit after years of strong dividend increases.
Energy (-6%) and Materials (-18%) companies decreased their payout the most, reflecting weakness in commodity prices. Large dollar decreases came from UK materials business Glencore Plc and US energy company, ConocoPhillips.
Interesting facts in global income
When incorporating dividend cuts and initiations, 3.9 companies increased or initiated dividends for every one company that reduced or completely cut dividends versus the previous corresponding period. This is further proof of dividends continuing to strengthen.
49% of US companies paid a dividend in Q2. Given it is the second quarter, a lot of European countries had a strong percentage of companies paying dividends (France 63%, Germany 65%, Italy 77%, Belgium 88%).
Source: Plato Investment Management
What’s the outlook for global income?
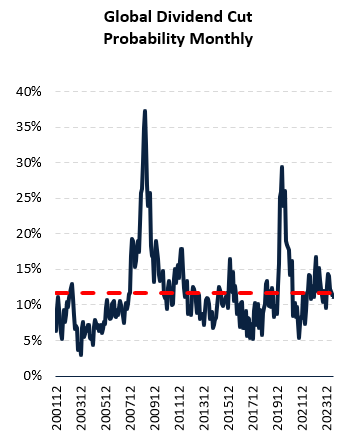
Our model continues to predict a lower-than-average probability of dividend cuts in global developed markets. Dividend growth has been strong, at the market level, despite increased interest rates, cost of living pressures and continuing geopolitical turmoil in Europe and the Middle East.
Materials/Energy significantly decreased dividends in Q2 and remain one of the higher risk areas in the market. After a strong 2022, they have decreased yields on the back of falling commodity prices and challenges to the demand side.
In conclusion
2024 started with incredibly strong market returns, although this moderated in Q2. As we stand halfway through the year, this has been another period of positive dividend growth for investors allocating to global equities.
Recent market returns have been dominated by growth names, and dividend payouts have benefitted from large companies in this space, like Meta and Alphabet, starting to pay dividends. The disparity between yields from different sectors continues to demonstrate the importance of active management, and a strong risk management framework, for income investors.
Methodology
- The methodology uses dividends paid, in AUD, however the ex-dividend date is used to allocate the dividends in the relevant time period e.g. Q3 2020.
- Dividend paid ($) for each stock in each calendar quarter is calculated as the shares outstanding as of quarter end multiplied by the total gross dividend per share (DPS) paid out in the calendar quarter. The DPS paid excludes spin offs but includes capital returns and special dividends. Conversion to AUD is done using the prevailing WM/Reuters London exchange rates at the time of dividend payment.
- Full year dividend paid ($) is the summation of dividend paid ($) from Q1 to Q4 using the methodology (1).
- DPS movement is based on total DPS paid out (in local currencies) over each calendar quarter. DPS movement from quarter to quarter is then categorised as initiating, increasing, unchanged, decreasing or cut to zero.
- Secondary issues are removed from the calculations to prevent double counting of income.
Daniel Pennell is Portfolio Manager of the Plato Global Shares Income Fund.
This article is for general information purposes only. It has been prepared without taking account of any person’s objectives, financial situation or needs. Any opinions or forecasts reflect the judgment and assumptions of Plato and its representatives on the basis of information at the date of publication and may later change without notice. Any persons relying on this information should obtain professional advice relevant to their particular circumstances, needs and investment objectives.
Plato Investment Management Limited ABN 77 120 730 136 (‘Plato’) AFSL 504616.