Register For Our Mailing List

Register to receive our free weekly newsletter including editorials.

Home / 522

30-year chart is pointer to retirement outcomes

Every retirement financial plan includes a variety of assumptions, as nobody knows what life will throw at them. Retirement often comes with the added uncertainties of a loss of income from work, ongoing health problems and greater flexibility in using time. In a world where headlines prefer gloom over optimism, retirees face perhaps 30 years of investing not knowing the returns or risks they face. However, while ‘failing to plan is planning to fail’ is an exaggeration, a long-term plan can draw on the past to make more informed decisions.

Each year, Vanguard releases an Index Chart which shows the performance of major asset classes over the previous 30 years. It is an appropriate period for retirees and advisers to judge long-term investing plans and outcomes as it also coincides with the likely period of retirement.

Balaji Gopal, Head of Financial Adviser Services at Vanguard Australia, says:

“While investors shouldn’t rely on past performance, 30 years of market history has proved that the impact of geopolitical, economic and social events on performance is usually short-lived, and markets will typically recover and rise over time. Looking back over the last few decades, bear markets on average last only 0.9 years and are generally followed by a bull market, averaging 6.5 years. Investors who stay invested through downturns are therefore best poised to benefit when markets inevitably bounce back.”

Let’s first look and how long people are likely to live then check the asset performance numbers.

Life expectancy at 65 is not the same as at birth

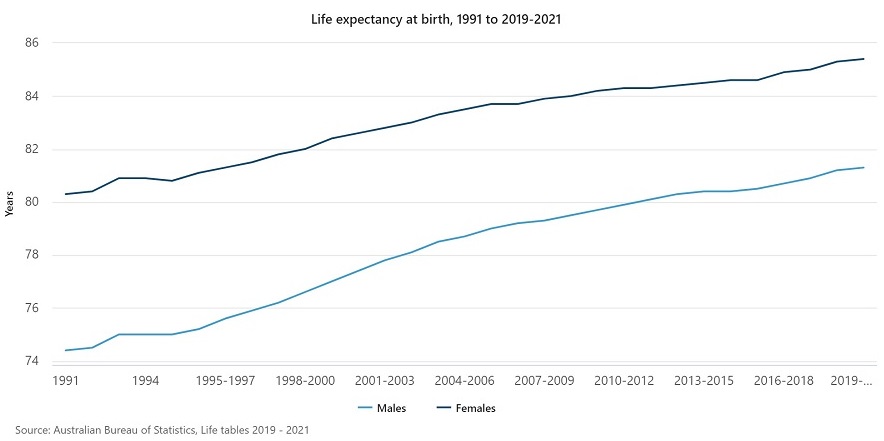
There is a common misunderstanding about life expectancy as quoted in the Life Tables issued by the Australian Bureau of Statistics (ABS). The latest ABS release shows life expectancy at birth is:

  • In 2021, 81.3 years for males (in 1991, 74.4 years), and
  • In 2021, 85.4 years for females (in 1991, 80.3 years).

In the 30 years since 1991, the gap between male and female life expectancy has narrowed from 5.9 years to 4.1 years. Males are living 6.9 years longer than in 1991, rising at the rate of a year of life expectancy for every four to five years. Perhaps add another seven years of life expectancy over the next 30 years, although diet and the pandemic may compromise long-term trends.

But these numbers are life expectancy at birth, while life expectancy generally is defined as:

“The average number of additional years a person of a given age and sex could be expected to live, assuming current age-sex specific death rates and experienced throughout their lifetimes.”

Here’s the common mistake. The ages above should not be used when planning the retirement spending and savings of a couple retiring at age 65. They have the benefit of not dying between the ages of 0-65, and the relevant statistics for them are life expectancy at age 65. A male aged 65 is not expected to die at age 81 nor a female at 85 and anyone planning for only 16 to 20 years of retirement is likely to underestimate.

How long will most people spend in retirement?

The latest OECD statistics for life expectancy at 65 show Australia is near the top for both men and women, in a group of six at least a year ahead of other countries. The longest, as shown below, are Japan, Korea, Spain, France, Switzerland and Australia. The y-axis is number of years of life expectancy at 65.

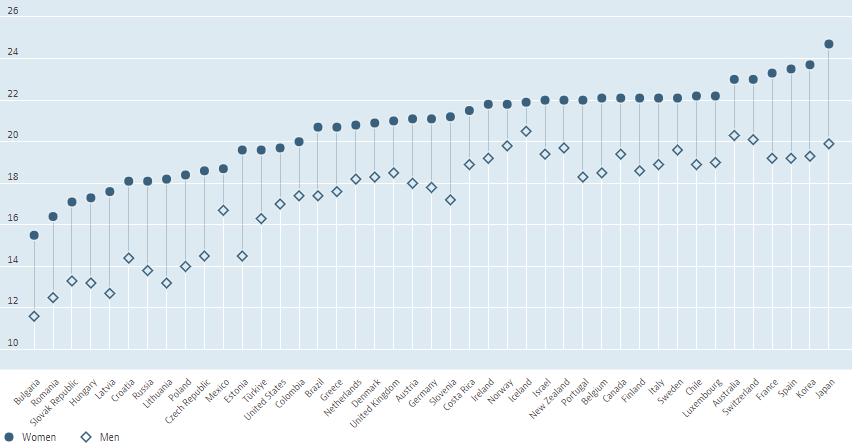
For Australia, the statistics for life expectancy at age 65 are:

  • Men, 20.3 years
  • Women, 23.0 years

Which suggests men will live to about 85 and women to 88 on average.

But that’s half the story. Life expectancy is based on the 50th percentile, meaning there is a 50% chance of living beyond the average. Plus most people enter retirement as a couple sharing income and expenses rather than as two individuals. Life expectancy plans for a couple need to head towards the ages of 95 to 100, as shown in the following table (based on US data) by Michael Kitces, a leading US financial adviser and consultant to the advice industry.

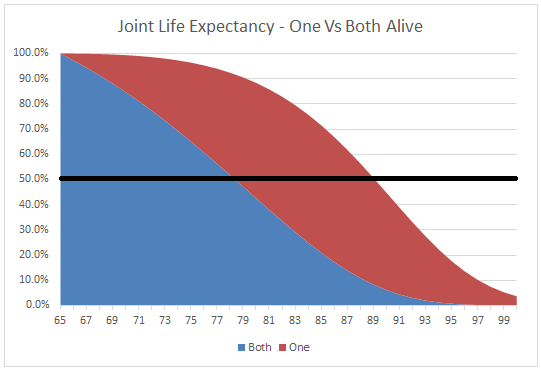
There is a useful overlap between the investment planning horizon for an Australian couple of 30 years after retiring at 65, and the Vanguard data of 30 years.

Retirement planning is not only about savings

A reminder that Australia’s retirement system includes three components, and I argue, a fourth for most people. They are:

  1. Savings inside the superannuation system
  2. Savings outside the superannuation system
  3. Age pension and other social security benefits
  4. Access to equity in the family home.

A complete picture of all components should be included in any comprehensive retirement plan, bearing in mind there will always be calls for the age of access to the age pension to push out. Recent research includes:

“With protests against raising the pension age raging in France, statistical modelling from the Macquarie Business School suggests Australia’s optimal pension age should be increased to 68 by 2030, 69 by 2036 and 70 by 2050.”

Investment performance over the last 30 years

Over the last 30 years, Australian shares on average have returned 9.2% per annum, with a healthy 14.8% in 2022/2023 in contrast to a sobering -7.4% the previous year. All asset classes except cash delivered negative returns in 2021/2022, including an unusual correlation between equity and bond returns. Defensive assets generally did not provide protection, although usually, diversification reduces market volatility.

Vanguard provides the following chart on the performance of an initial investment of $10,000 invested in the major asset classes, with US shares winning handsomely. In the past, therefore, taking equity risk has been rewarded for those who can tolerate the greater risk, and there is a cost to pay for cash’s defensive qualities. Note these are nominal not real returns, so there is no adjustment for inflation.


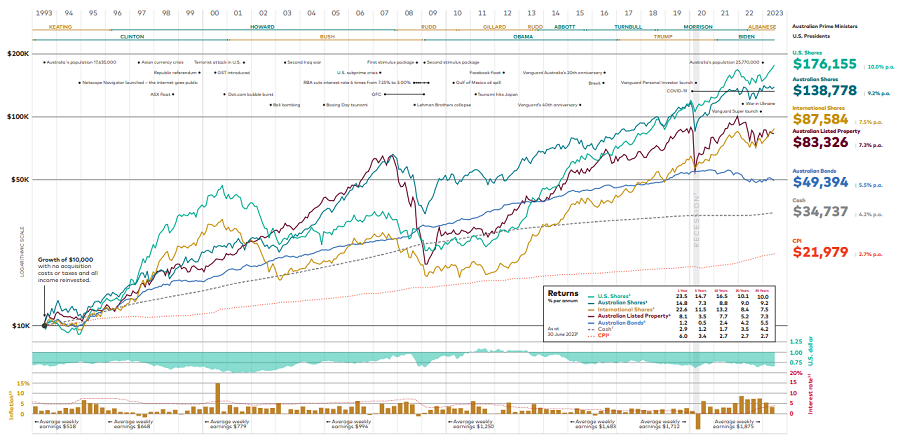
The Vanguard chart is detailed, click here to view or download a larger version.

$10,000 invested in 1993

Accumulated investment value at 30 June 2023*

% returns per annum

Australian Shares

$138,778

9.2%

U.S. Shares

$176,155

10.0%

International Shares

$87,584

7.5%

Australian Bonds

$49,394

5.5%

Australian Listed Property

$83,326

7.3%

Cash

$34,737

4.2%

*with no acquisition costs or taxes, and all income reinvested. Source: Vanguard

Check the fees

As a major provider of funds based on various indexes, Vanguard makes the case for investing in index funds to reduce costs, but investors should note that Exchange Traded Funds are not all index funds, and neither are managed funds all active. Check the fee and don’t assume ETFs are always cheap as some are actively managed with high base and performance fees.

For example, Morningstar data on Australian ETFs, as shown in the table below, shows the weighted average cost of passive (index) ETFs is 0.24%, while active ETFs are at 0.65%. The simple average (all funds given equal weight regardless of size) is 0.92% which shows some active ETFs are as expensive as managed funds.

Fee Comparison for ETF Cohort

ETF Cohort

Simple Average

Asset Weighted Average

Pure Passive ETFs

0.44%

0.24%

Strategic Beta ETFs

0.43%

0.36%

Sustainable ETFs

0.57%

0.48%

Active ETFs

0.92%

0.65%

Source: Morningstar Direct, Morningstar Research. Data at 31 December 2022.

Would you bank these returns for the next 30 years?

Given the chance to earn these returns for the next 30 years, how many investors would say earning 9-10% (in nominal terms, not adjusted for inflation) on their equity portfolio throughout retirement is adequate and bank that level now? It’s my guess that the vast majority would accept. I would, but the numbers come with the benefit of only considering the handsome 30-year returns and not the volatile journey endured to get there, including losing half the value of shares during the GFC.

A qualification is that there are always reasons to argue future returns will be lower. We could now say that past returns benefitted from cheap energy while the future of energy transition will cost trillions, that past Chinese growth will be replaced by a stagnating economy, that the Ukraine war will disrupt for years, that demographic changes and an ageing population will hit growth, etc, etc. But stockmarkets have delivered opportunities for centuries, and the more optimistic outlook is to place faith in the ingenuity of people to solve problems.

Most retirees find the volatility of a 100% exposure to equities unacceptable, so some mix into other asset classes is required to manage the risk. The results show that staying invested for the long run is likely to be rewarded, although investing broadly and diversifying is a safer route.


Graham Hand is Editor-At-Large for Firstlinks, and this article is general information and does not consider the circumstances of any investor.


12 Comments
DMW
August 27, 2023

This history parallels a time of declining interest rates and low inflation. Longer term trends suggest that this will change and may suggest a more balanced view to capture optimal returns. Of course rising debt levels, geopolitical turmoil and nationalism will also play a macro role.

Steve F
August 19, 2023

The key factor missing from Vanguard's charts are imputation credits for Australian shares. These are significant and should be considered additional income for reinvestment, just as cash dividends.

I think you'll find that including this would change the final rankings quite a bit.

David
August 18, 2023

I believe that one key to this successful investing within my SMSF has been having some sense of balance. Interest bearing investments IAM or BGC as well as the High Yield Aura Investments. Some Hybrids are part of the balance.
A balance across the Shares is equally important.
My risk appetite is slightly higher than others as I will write options on my high quality stocks.
As we all know life is short and we will always make some mistakes. But we learn from them ( hopefully). My age is 77.
Finally not enough emphasis is given to that terrible matter….Taxation.

Graham W
August 18, 2023


I would argue that there is a fifth component for some 65 year old retirees to consider. And that is an inheritance from parents in their late eighties and nineties. I know of a number of friends that this is relevant to.
Missing from the performance charts is gold bullion. Since 1993 gold's performance is way better than bonds, property and cash. No income but generally no ongoing fees and immediately cashable with no counterparty risk.
Gold sovereigns in 1993 around $140 each now $1,200 to $2,000.

straight shooter
August 18, 2023

Agree but how would you expect a 70 year old be able to sell gold billion?

Graham W
August 18, 2023

Sovereigns are readily sold, bullion also to say Perth Mint or ABC Bullion. It would be one of the last investments that I would sell anyway. I am in my seventies and will probably pass on my AG and Au to my fa

SMSF Trustee
August 27, 2023

Comparing a volatile asset, which includes currency risk as the world price is in US$, with bonds and cash would get a licensed adviser run out of the business. So what if a commodity that is nothing like bonds and cash has done better over a 30 year period? You don't hold bonds and cash if you have a long term horizon like that!

Over 30 years give me the growing income and capital value of a decent equity portfolio (domestic and global) any day.

Neil
August 17, 2023

The mgmt fee costs and inflation are both mentioned as detractors from the reported asset class returns.

Tax is another important factor not mentioned. Not just how an investor structures their own portfolios (eg. super funds, trusts, individual), but also asset class specific factors (eg. imputation credits, CGT discounts, deferred income from property, CGT exemption on homes, withholding taxes), and not to mention "death taxes" on inheritances.

ROMANO SALA TENNA
August 17, 2023

Great piece -we have been speaking to this anecdotally for some time and we now have some up to date data.
A must read for all financial advisers and anyone approaching retirement.

Fergus Hardingham
August 18, 2023

Hi Romano, your FUND is very active and allocates to CASH as well and has significantly beaten (net of fees) your BENCHMARK INDEX (all ORDS ACCUM) since end of MARCH 2020...just a comment.

Mart
August 17, 2023

Thank you Graham (and Vanguard) ... the stats don't lie (and they give the same trend over a longer time period too). So is it simply a case of a mantra of: if you are investing for the long term (which the life expectancy charts suggest you need to) then just 'set and forget' with an ETF like VAS, VGS or similar and then tune out all noise ? Seems like it, but you'd probably need to have a strong constitution to stay the course ! As you note, the nuance is important regarding cost, which index to select to track etc. To pick one example here, Peter Thornhill (no stranger to Firstlinks) would suggest well established (i.e.solid track record), low cost LICs that adhere to the Industrials index for superior performance. No doubt true, but even though the Vanguard chart shows US shares are the 'winner' over 30 years I for one would be pretty happy making the 'mistake' of selecting Aussie shares ! As Warren Buffet suggests, most people would do best by selecting a low cost index tracker and just stay the course (and reinvest dividends when able to)....

Steve
August 20, 2023

The 5 Yr charts show that Buffet's BRK-A has achieved 71% whereas the S&P500 has only achieved 52%.


Leave a Comment:

RELATED ARTICLES

40 years on, how European travel and we have changed

The three pillars to a happy retirement

Ukraine-Russia conflict update: Compendium of research

banner

Most viewed in recent weeks

2024/25 super thresholds – key changes and implications

The ATO has released all the superannuation rates and thresholds that will apply from 1 July 2024. Here's what’s changing and what’s not, and some key considerations and opportunities in the lead up to 30 June and beyond.

Five months on from cancer diagnosis

Life has radically shifted with my brain cancer, and I don’t know if it will ever be the same again. After decades of writing and a dozen years with Firstlinks, I still want to contribute, but exactly how and when I do that is unclear.

Is Australia ready for its population growth over the next decade?

Australia will have 3.7 million more people in a decade's time, though the growth won't be evenly distributed. Over 85s will see the fastest growth, while the number of younger people will barely rise. 

Welcome to Firstlinks Edition 552 with weekend update

Being rich is having a high-paying job and accumulating fancy houses and cars, while being wealthy is owning assets that provide passive income, as well as freedom and flexibility. Knowing the difference can reframe your life.

  • 21 March 2024

Why LICs may be close to bottoming

Investor disgust, consolidation, de-listings, price discounts, activist investors entering - it’s what typically happens at business cycle troughs, and it’s happening to LICs now. That may present a potential opportunity.

The public servants demanding $3m super tax exemption

The $3 million super tax will capture retired, and soon to retire, public servants and politicians who are members of defined benefit superannuation schemes. Lobbying efforts for exemptions to the tax are intensifying.

Latest Updates

Retirement

Uncomfortable truths: The real cost of living in retirement

How useful are the retirement savings and spending targets put out by various groups such as ASFA? Not very, and it's reducing the ability of ordinary retirees to fully understand their retirement income options.

Shares

On the virtue of owning wonderful businesses like CBA

The US market has pummelled Australia's over the past 16 years and for good reason: it has some incredible businesses. Australia does too, but if you want to enjoy US-type returns, you need to know where to look.

Investment strategies

Why bank hybrids are being priced at a premium

As long as the banks have no desire to pay up for term deposit funding - which looks likely for a while yet - investors will continue to pay a premium for the higher yielding, but riskier hybrid instrument.

Investment strategies

The Magnificent Seven's dominance poses ever-growing risks

The rise of the Magnificent Seven and their large weighting in US indices has led to debate about concentration risk in markets. Whatever your view, the crowding into these stocks poses several challenges for global investors.

Strategy

Wealth is more than a number

Money can bolster our joy in real ways. However, if we relentlessly chase wealth at the expense of other facets of well-being, history and science both teach us that it will lead to a hollowing out of life.

The copper bull market may have years to run

The copper market is barrelling towards a significant deficit and price surge over the next few decades that investors should not discount when looking at the potential for artificial intelligence and renewable energy.

Property

Global REITs are on sale

Global REITs have been out of favour for some time. While office remains a concern, the rest of the sector is in good shape and offers compelling value, with many REITs trading below underlying asset replacement costs.

Sponsors

Alliances

© 2024 Morningstar, Inc. All rights reserved.

Disclaimer
The data, research and opinions provided here are for information purposes; are not an offer to buy or sell a security; and are not warranted to be correct, complete or accurate. Morningstar, its affiliates, and third-party content providers are not responsible for any investment decisions, damages or losses resulting from, or related to, the data and analyses or their use. To the extent any content is general advice, it has been prepared for clients of Morningstar Australasia Pty Ltd (ABN: 95 090 665 544, AFSL: 240892), without reference to your financial objectives, situation or needs. For more information refer to our Financial Services Guide. You should consider the advice in light of these matters and if applicable, the relevant Product Disclosure Statement before making any decision to invest. Past performance does not necessarily indicate a financial product’s future performance. To obtain advice tailored to your situation, contact a professional financial adviser. Articles are current as at date of publication.
This website contains information and opinions provided by third parties. Inclusion of this information does not necessarily represent Morningstar’s positions, strategies or opinions and should not be considered an endorsement by Morningstar.