Michael Mauboussin and Dan Callahan of Morgan Stanley Counterpoint Global recently published a terrific study that looked at how often individual stocks suffered deep losses. To sum up their findings – even the best performing stocks had to overcome painful drawdowns along the way. Or as they put it:
“The best stocks and investors suffer through large drawdowns, which can be considered a cost of doing business over the long haul.”
A dumpster-diving strategy
That made me wonder: How would a strategy built around systematically buying-and-holding stocks after they’d gotten crushed have done? After all, it stands to reason that if you focus on stocks that get pummeled, you’re bound to pick up a few ‘super-compounders’, kind of like panning for gold.
With that in mind, I built five hypothetical strategies that did variations of that very thing – they bought stocks right after they’d experienced a loss of at least 50% and then left them more-or-less untouched from there. (For a fuller explanation of how I built these hypotheticals, see the Appendix section.) Those strategies include the following:
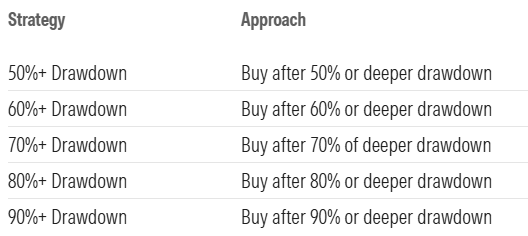
Encouraging results
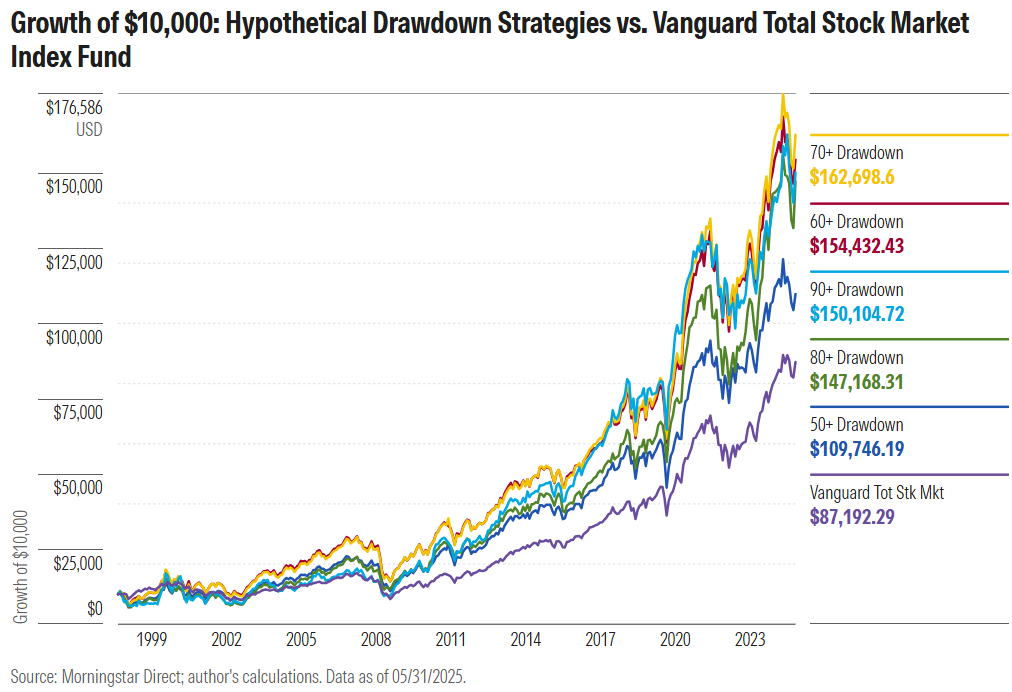
How’d these strategies do? Quite well. All five would have delivered higher returns than the broad US stock market (proxy being Vanguard Total Stock Market Index Fund) since March 1998. The 70%+ Drawdown portfolio, for instance, would have gained around 10.8% a year from April 1, 2008, through May 31, 2025, versus 8.3% annually for the Vanguard fund.
What was the catch? Volatility. These hypothetical portfolios had a higher standard deviation of returns than the broad market did. (Also, it’s not exactly fun to be buying the market’s dregs, knowing a number of these stocks won’t be able to reverse their decline.)
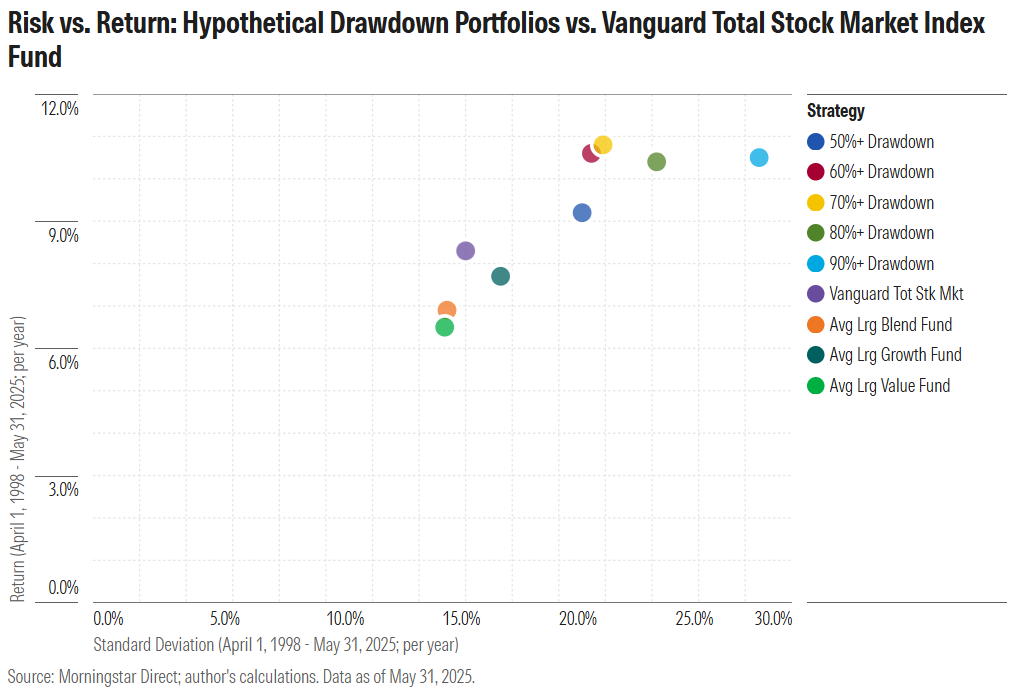
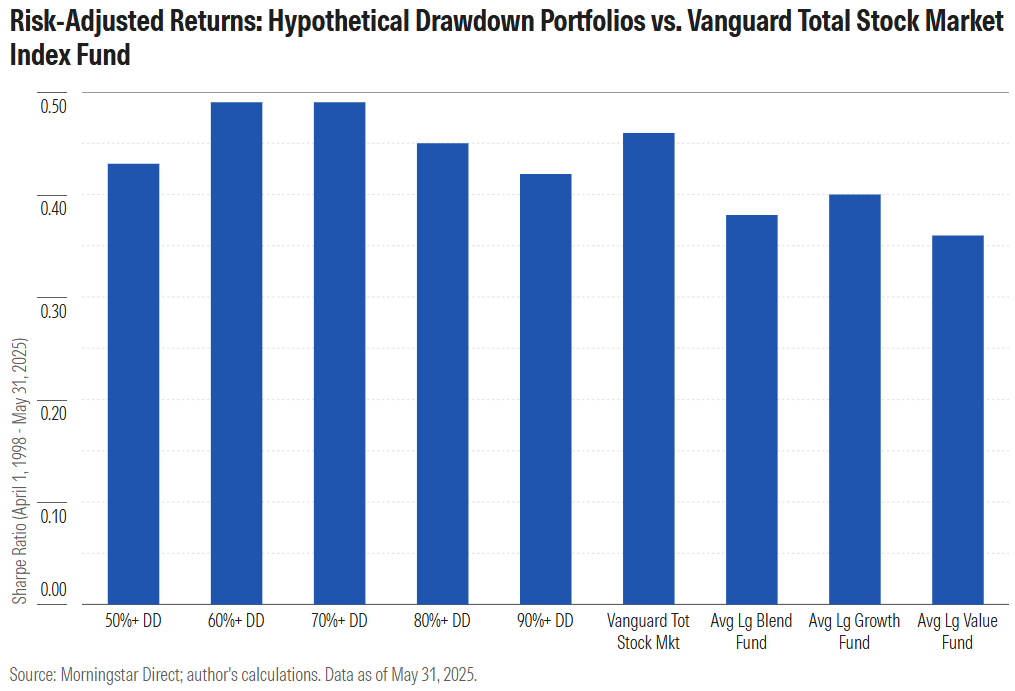
Nevertheless, two of the five generated returns more than compensated for that extra volatility, as evidenced by their higher Sharpe ratios compared with the Vanguard fund. In addition, all five portfolios’ risk-adjusted returns would have trounced the average large-cap mutual fund’s. In fact, the strategies’ returns would have ranked in the top 5% of all funds that survived this multi-decade period.
Why It worked
This is not an easy strategy to live with. When stocks enter the portfolio, they’ve already gotten smoked. Many don’t or won’t recover. The data bears this out vividly.
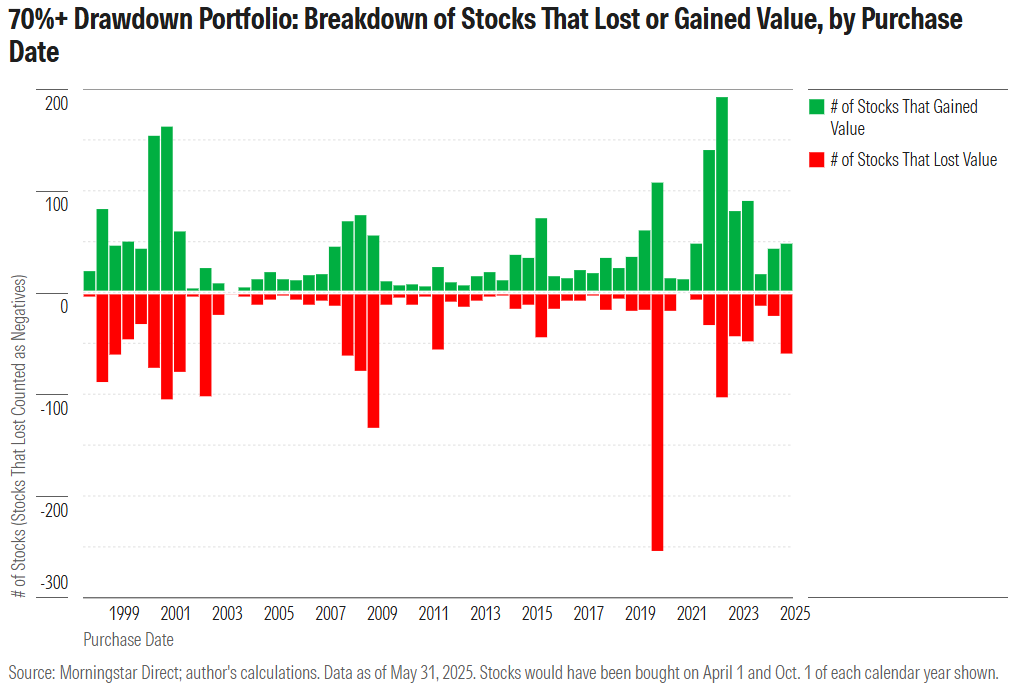
For example, the 70%+ Drawdown portfolio held more than 4,100 stocks from April 1998 through May 2025. Of those stocks, 401 subsequently lost all their value, 1,117 lost 90% or more of their value, and 1,718 were at least cut in half. All told, 2,288 of the holdings lost money.
Here’s a breakdown of how many stocks gained value after the portfolio bought them and how many lost, broken down by purchase date. Note the lumpiness of purchase activity, which reflects the reality that drawdowns cluster amid bear markets like 2000-02 and the global financial crisis from 2007-09.
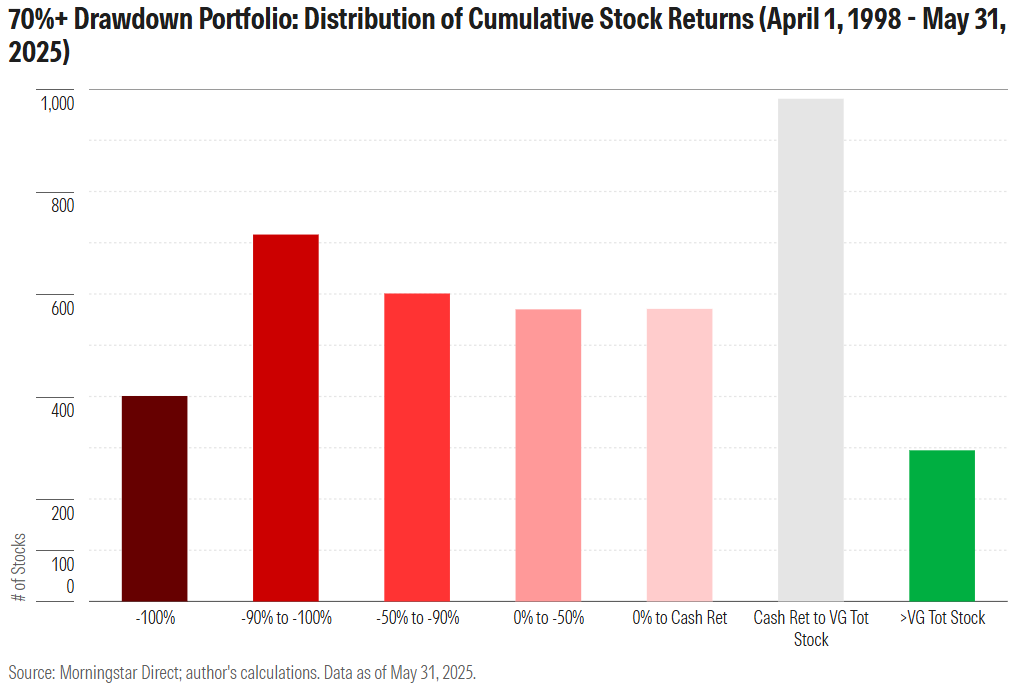
With respect to the 1,800 or so stocks that earned a positive return, 571 gained no more than cash and another 981 outearned T-bills but lagged the Vanguard fund. That left a pool of fewer than 300 stocks that outperformed the Vanguard fund. It was these stocks that drove the portfolio’s excess returns, with the distribution of stock returns shown below.
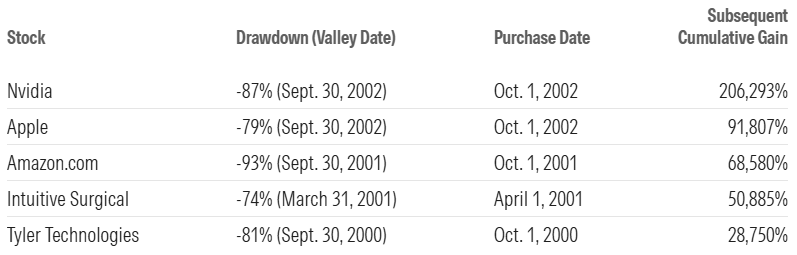
Which stocks were those? Here are the five biggest gainers in the 70%+ Drawdown portfolio, including when each saw its big drawdown, when it entered the portfolio, and how much it subsequently rose.
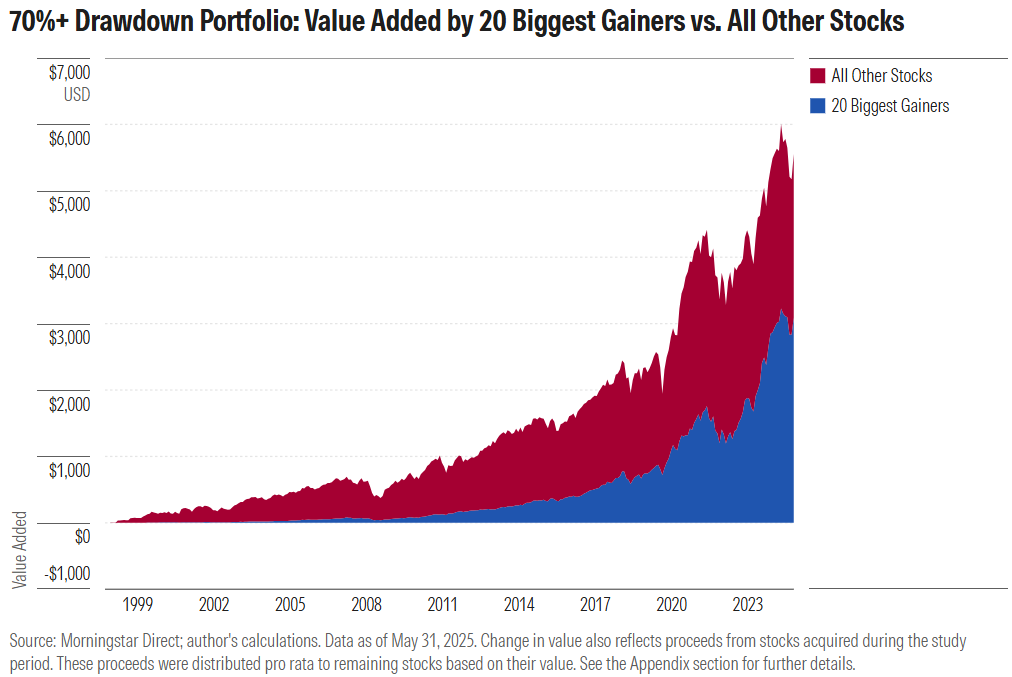
The average stock gained about 314% cumulatively, while the 70%+ Drawdown portfolio held it, but the median stock lost 20% of its value. In other words, the biggest winners carried the strategy, with the top-20 gainers alone adding as much value as all the other holdings combined.
It was also instructive to look at how each batch of stocks performed compared with the Vanguard fund – for instance, how the stocks that had a 70% or deeper drawdown as of, say, Sept. 30, 2012, did versus the Vanguard fund from that date through May 31, 2025, and so forth for the stocks added at other times after they troughed.
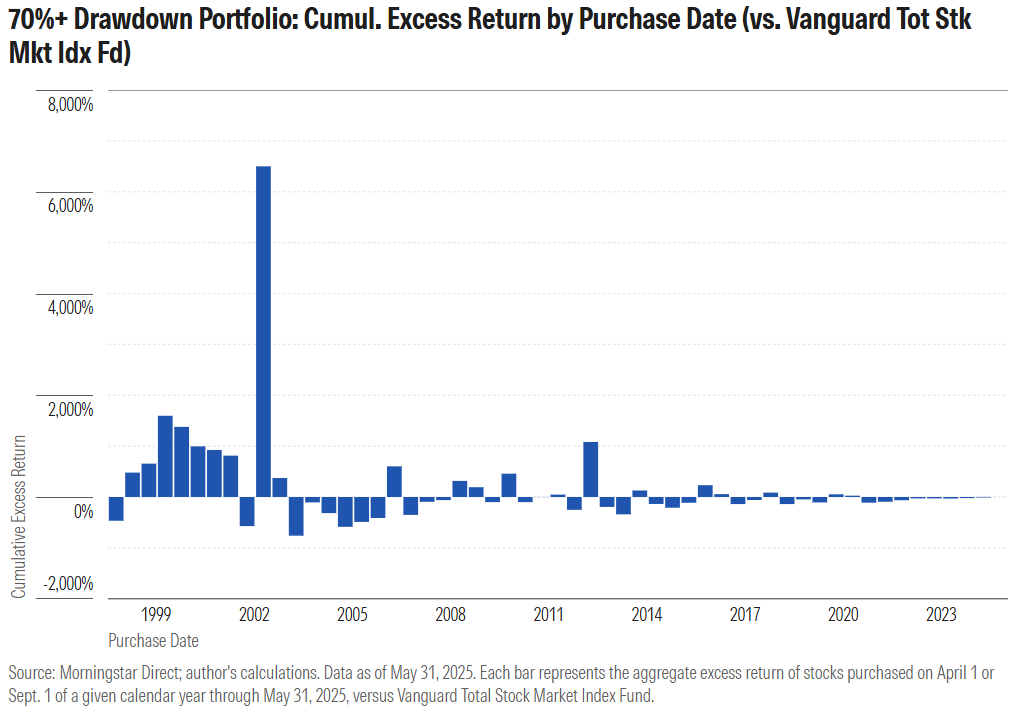
A few things become apparent. First, the 70%+ Drawdown strategy hit pay dirt in October 2002, which is when it scooped up Nvidia and Apple, which massively outperformed the market in the years since. The strategy’s excess returns moderated since then (especially in more recent years, as too little time elapsed for the stocks in those cohorts to work off losses they saw in 2020 and 2022), but subsequent batches also handily outperformed the Vanguard fund.
In addition, it’s evident that the strategy was likelier to succeed when it bought many stocks that had hit their lows as of that date. For example, 228 stocks had a maximum drawdown of 70% or more as of Sept. 30, 2000. In aggregate, those stocks posted a 1,545% cumulative gain from Oct. 1, 2000, through May 31, 2025. That surpassed the Vanguard fund’s 550% cumulative return over that span by nearly 1,000 basis points.
Conversely, when there were fewer stocks with maximum drawdowns as of a certain date, the strategy didn’t fare as well. That was true of the nine stocks that had a maximum drawdown of 70% or more as of March 31, 2004. In aggregate, those stocks proceeded to rise 557% in value through May 31, 2025, but that was more than 100 percentage points less than the Vanguard fund’s 663% cumulative gain over that period.
Why you won’t see fund companies offer it
Stranger things have happened, but despite the strategy’s success, you’re probably not going to see a fund manager rush to offer it. Why? Let me count the reasons.
Reason 1: Tough sell
As I mentioned, this is a hard strategy to love. It buys the market’s rejects at their (almost literal) nadir. Also, it’s go-anywhere, meaning it invests in stocks of any size or style, defying easy classification, and lets its biggest winners run, leaving the portfolio top-heavy (Nvidia was a 13% weight in the 70%+ Drawdown portfolio by the end). All that would make it a tough sell – one that most fund companies wouldn’t bother to pursue.
Reason 2: Tests patience
This is not an instant-gratification approach. It takes nerve and the resolve to look past all the losing stocks it inevitably entails owning, as you can’t get the good without the bad. The typical fund company lacks the patience for this, preferring a quicker return.
Reason 3: Not enough headroom
Because these stocks have been pounded down, they tended to be on the smaller side when they entered the portfolio. That was true of Nvidia, for instance, which had a scant $1.6 billion market cap in October 2002, when it would have been bought. That could make the stocks tougher to own at scale without running into capacity challenges. Fund companies don’t like capping their upside asset growth, so they’d likely see this as a deterrent.
Reason 4: Unpredictability
While the strategies generally succeeded in beating the broad US stock market, that success wasn’t linear. There were fertile periods, when large numbers of stocks saw deep drawdowns, among them some names that went on to be hyper-winners. But there were also fallow periods when relatively few stocks surfaced and those that did were mainly stinkers. That could lead to streakiness or, in modern investment management parlance, ‘tracking error’ that invites unwanted questions from allocator and gatekeeper types.
The lesson in that
There’s a lesson in professional investors’ likely reluctance to launch strategies like these. What they might see as a limit or encumbrance on their business objectives can present an opportunity to individual investors who face no such trade-offs.
For instance, you or I don’t have to hawk the strategy to the public. The only question is whether it’s right for us, given our goals. We also don’t answer to other shareholders or an investment committee, like a portfolio manager might, and so can exercise whatever patience the investment approach demands. Likewise, we’re in a far better position to invest in smaller stocks, as we don’t face the capacity constraints an institution might.
To be sure, this is not a painless approach. You’re bellying up to buy stocks, sometimes numerous stocks, beset by doubts about their prospects, knowing full well that many will have dismal results. Also, the strategy does require some maintenance—because so many of the stocks end up being acquired, an investor would want to redirect the proceeds to existing holdings, essentially feeding the relatively few big winners to ensure they more-than-offset the many losers.
But to the enterprising few with a healthy constitution and willingness to go their own way, opportunity beckons.
Appendix
I constructed each hypothetical strategy as follows:
- I compiled the March and September portfolios of Vanguard Total Stock Market Index Fund for the years 1998 through March 2025.
- For each portfolio, I calculated every stock holding’s maximum drawdown—that is, peak-to-valley loss—over the 10-year period ended on the portfolio date. So, for instance, if the portfolio was dated Sept. 30, 2014, I calculated each stock’s deepest month-end-to-month-end loss over the decade ended that date.
- Within each portfolio, I focused on the stocks that were at their lows as of the portfolio date. In other words, I focused on the stocks in the Sept. 30, 2014, portfolio whose ‘maximum drawdown valley date’ was Sept. 30, 2014, and so forth for the other portfolios.
- Among those stocks, I threw out any that had lost less than 50% as well as those that by then had already had a 95% or deeper drawdown. That kept the list to stocks that had at least gotten cut in half but hadn’t yet lost almost their entire value.
- I assumed the strategy bought each eligible stock on the first day of the month immediately following the date of their maximum drawdown valley date. So if the stock troughed on Sept. 30, 2014, I assumed it was bought on Oct. 1, 2014, and so forth. The strategy bought equal amounts of all new stocks on the dates they were added, with the funding for those purchases assumed to come from an external funding source. Stocks were purchased just once, not successively. In other words, if a stock had a 60%-plus drawdown, recovered, and then experienced another 60%-plus drawdown, it wasn’t purchased again upon the second drawdown.
- Once the strategy bought a stock, I assumed it was left untouched, with two exceptions. First, I assumed stocks that lost 98% of their value were sold, with the proceeds remaining in cash. Second, I assumed the proceeds of stocks that were obsoleted (that is, where the monthly return stream stopped before May 31, 2025) were recycled pro rata into existing holdings based on those stocks’ relative weights in the month that immediately followed the month in which those stocks went obsolete.
Jeffrey Ptak, CFA, is managing director for Morningstar Research Services LLC. The opinions expressed here are the author's. The author does not own shares in any securities mentioned in this article. This article is general information and does not consider the circumstances of any investor. Originally published by Morningstar and edited slightly to suit an Australian audience.
Try Morningstar Investor for free