The 2023 Intergenerational Report (IGR) helps us understand the consequences of Australia’s ageing population. Therefore, how we measure our ageing population is really important.
Traditionally, we have used the old-age dependency ratio which compares the population aged 65 and over with the so-called working age population, the people aged 15-64. The IGR continues to publish this ratio, but this approach is outdated and can lead to unnecessary fear and even unhelpful policies.
This article shows that by using a realistic approach, Australia's population is ageing at less than half the rate commonly quoted.
Ageing population ratios
The world’s population is ageing as we live longer and have fewer babies. This is a fact and will affect every country and every economy during the next two, three or four decades. In many countries, the retirement of the baby boomer generation from the workforce is highlighting the issue. The consequences can be many with reducing populations, a smaller labour force and increased costs for pensions, health services and aged care.
The most used calculation to measure the ageing population is the old-age dependency ratio, as defined above. Figure 1 shows this percentage ratio for Australia from 1982 to 2061, that is, the last 40 years and the projected ratio for the next 40 years. This figure highlights the steady increase in the ratio since 1982 and the expectation that it will continue to rise in the future.
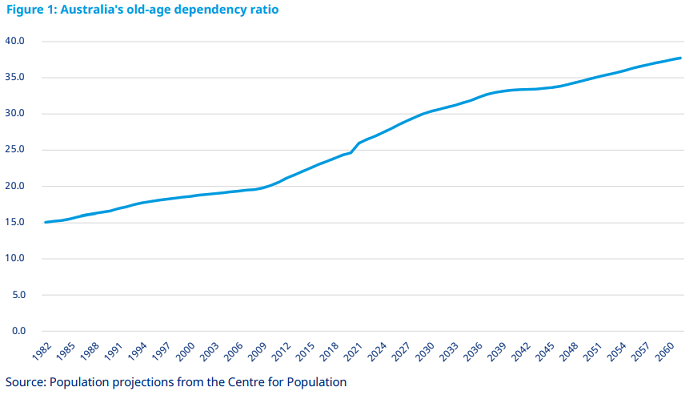
Such a ratio can be useful in comparing the demography of different countries and the sustainability of different pension systems, (e.g. as used by the Mercer CFA Institute Global Pension Index). It is also useful in highlighting the ageing population for the development of appropriate public policy, as in Treasury’s 2021 IGR and the 2022 Population Statement.
However, if we are concerned with a single economy such as Australia, then this ratio with its fixed definitions becomes less helpful with the many changes that occur within the workforce and life expectancies over an 80-year period.
The history: 1982-2022
The old-age dependency ratio uses the population aged 15-64 as the denominator; that is, the population of traditional working ages. Yet many of these individuals are not in the workforce due to a range of reasons while others aged 65 or over are in the workforce. A more accurate approach would be to consider the actual labour force, rather than the potential labour force.
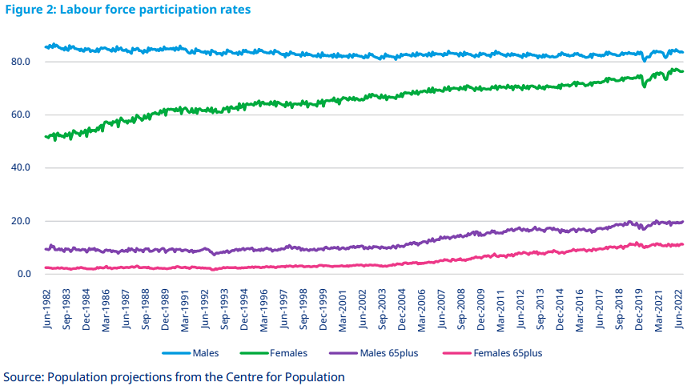
Figure 2 shows some significant changes in our labour force participation rates over the last 40 years. In particular, the female participation rate has increased significantly and, recently, more individuals over the age of 65 are in the labour force. In fact, the percentage of the labour force aged 65 and over has increased from 1.99% of the total labour force in 2006 to 4.94% in 2022. This trend is expected to continue in future years.
Hence with this changing labour force, it’s important that we consider the number of people aged 65 and over per 100 people in the actual labour force rather than those within a particular age group. Figure 3 compares this adjusted ratio with the standard ratio for the last 40 years.
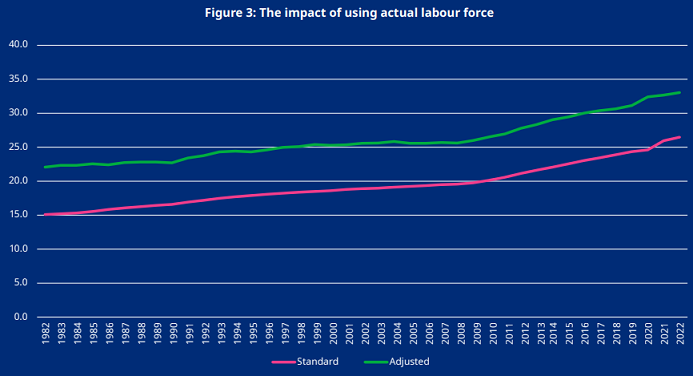
Two effects are evident:
- The adjusted ratio is higher than the standard ratio because the actual labour force used in the denominator is less than the population aged 15-64 as those aged 15-64 not in the workforce (and therefore now excluded) are greater than those in the workforce aged 65 and over who are now included.
- The increase in the adjusted ratio is not as significant as in the standard ratio, due to the increasing female labour force participation rate. The standard ratio shows that the number of working age persons for every person aged 65 or over decreased from 6.6 in 1982 to 3.8 in 2022 whereas the adjusted ratio shows the decrease has been from 4.5 in 1982 to 3.0 in 20221.
One further adjustment is required to obtain an even more accurate picture of our ageing population.
During this 40-year period, the life expectancy for a 65-year-old male increased by 6.55 years from 13.80 to 20.35 and by 4.98 years for a 65-year-old female from 18.00 to 22.982. This represents an average increase of 5.77 years over 40 years, or 1.7 months every year. The eligibility age for the Age Pension is also increasing from age 65 at 30 June 2017 to age 67 from 1 July 2023. Hence, age 65 is no longer a suitable age to define an older person in Australia.
However, increases in life expectancies only represent part of the story, as it is important to understand whether people are spending more years in good health or more years living with illness. A measure known as the health-adjusted life expectancy (HALE)3 is used to understand this difference.
The Australian Institute of Health and Welfare has shown that between 2003 and 2022, 58% of the increase in life expectancy for a 65-year-old female represented an increase in the HALE. The corresponding figure for a 65-year-old male was 76%4. This outcome of an increasing HALE represents one factor in leading to the increase in the labour force participation rate for those aged 65 and over.
Given that the increase in life expectancy for a 65-year-old from 1982 to 2022 was an average of 5.77 years, it is reasonable to suggest that during this period, the increase in the age to define an older person in full health could increase by 3 years or 52% of the increase in life expectancy.
Figure 4 shows the revised ratio assuming that the definition of an older person gradually increases from age 65 in 1982 to age 68 in 2022.
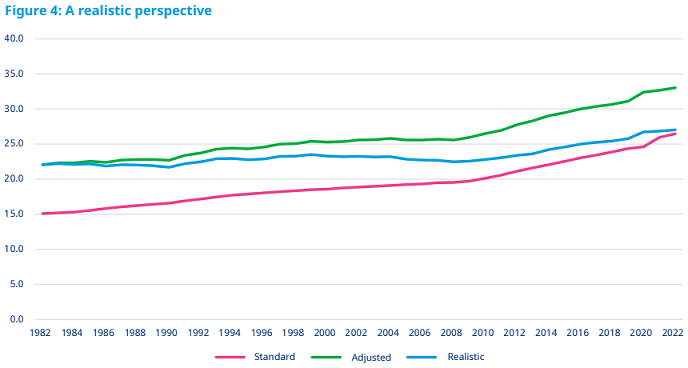
As expected, the final line using both the actual labour force and a gradual increase the age to define an older person is below the previous 'adjusted' line. There remains an increase in the ageing ratio, but it is much slower than the standard old-age dependency ratio or the adjusted line. The number of working age persons for every older person decreased from 4.5 in 1982 to 3.7 in 2022.
This much more modest decline than is normally used is due to the increasing labour force and the recognition that the definition of an older person should not remain static over 40 years.
Hence, the consequences of the recent ageing in our population are not as severe as often suggested. However, it is in the next 40 years where the impact may become more significant, particularly with additional health and aged care costs. Let’s now consider this future period and the likely ratio between the older population and those in the workforce.
The future 2022-20615
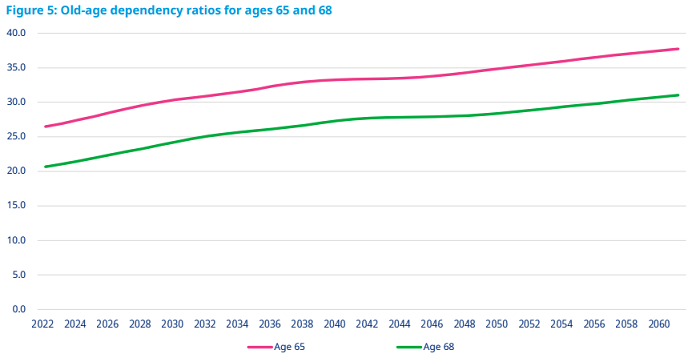
As we look to the future, let us begin with Figure 5, which shows the traditional old-age dependency ratio from Figure 1 and a revised line with an assumption that an older person in 2022 and beyond is aged 68 or over. As expected, the age 68 line is below the age 65 line.
Previously, we replaced the denominator, which was the population of working age, with the actual labour force. Of course, this calculation is more difficult looking into the future. We will begin by using the latest labour force participation rates to provide an initial estimate of the future labour force. However, these latest rates may not be a good indication of the future as participation rates for those aged 55-64 and 65 & over have been increasing in recent years. This outcome is not surprising, given the ongoing increase in the health-adjusted life expectancy.
For example, the labour force participation rate for those aged 55-64 increased from 59.6% in 2010 to 68.2% in 2021. Similarly, the participation rate for those aged 65 and over increased from 12.0% in 2015 to 15.0% in 2021. These rates are likely to increase even further. For example in New Zealand, the latest rates are 79.7% and 25.1% respectively whereas in Iceland they are 83.4% and 22.3% respectively.6
Therefore, we will gradually increase the participation rate for those aged 55-64 from 68.2% in 2021 by 0.5% pa until it reaches 78.2% in 2041. Similarly, we will increase the participation rate for those aged 65 and over by 0.25% pa from 15.0% in 2021 to 20.0% in 2041. These projected rates are still lower than the current participation rates in NZ and Iceland.
The 2021 IGR allowed for some increase in the participation rates at older ages from 2019-20 to 2060-61 while also noting that the total participation rate has consistently outperformed the projections in past intergenerational reports.7
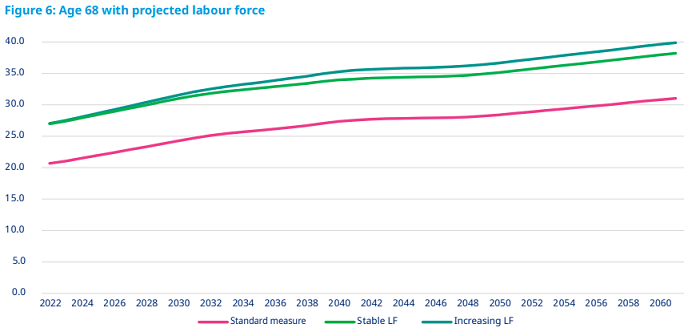
Figure 6 shows the impact of using the projected labour force instead of the working-age population as the denominator, as well as the impact of allowing for the increasing participation rates at older ages. The use of the projected labour force as the denominator means that the annual increase in the ratio is slightly less than if the projected population is used.
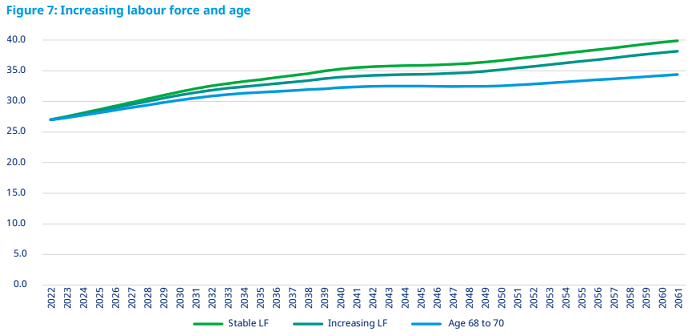
The next required adjustment is to recognise that life expectancies are likely to continue to increase in future years so that the definition of an older person should also increase. For example, the United Nations projects that the life expectancy for a 68 year old in Australia will increase gradually from 19.2 years in 2022 to 22.5 years in 2061 – an increase of 3.3 years.8 Based on the recent history of the relation between HALE and population life expectancy, it is reasonable to gradually increase the age used to define an older person by 2 years over the next 40 years; that is, from age 68 to age 70. This increase is less than the rate experienced during the previous 40 years.
Figure 7 shows the effect of this change in age as well as allowing for the increasing labour force as shown in Figure 6. The impact of these two realistic adjustments is material. That is, the compound annual growth in the ratio drops from 0.94% pa to 0.56% pa.
Suggested reforms
Mercer does not deny that Australia’s population is ageing. That is a fact, but the consequences are not as alarming as some would suggest. Figure 8 compares the standard old-age dependency ratio with the more realistic ratio based on the actual and projected labour force and a gradual increase in the age used to define an older person.
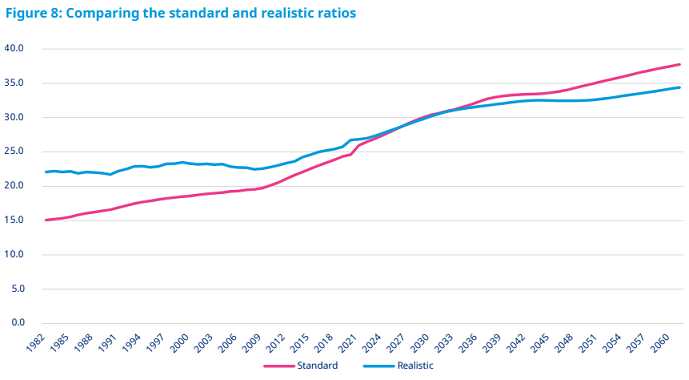
The more realistic ratio increases at a much slower rate than the standard old-age dependency ratio. In fact, over the period its annual growth rate is 0.56% pa compared to 1.17% pa for the standard ratio. To express these results another way, the realistic ratio suggests that the number of workers per older person will decrease from 4.5 in 1982 to 2.9 to 2061. This compares to the figures using the old-age dependency ratio, which suggests the number of working-age persons for every person aged 65 and over will decrease from 6.6 in 1982 to 2.7 in 2061
The more realistic view of the impact of our ageing population expressed in this article does not imply that there should be no changes in government policy. Reform is needed. Mercer therefore recommends:
- Governments and employers must recognise that people aged 65 and over will form an ever-increasing percentage of the labour force. Many older individuals are healthy; have considerable expertise and experience; and wish to continue to contribute. They should be encouraged to do so.
- The measurement of our future ageing population needs to be more dynamic than the use of static ratios. It must recognise that there are likely to be ongoing changes in the labour force and life expectancies. It is also recognised that models that are more comprehensive can allow for a broader range of parameters than used in this paper.
- The means tests for the Age Pension must also encourage older persons to remain in the workforce to a much stronger extent than the current policy. Such an outcome is beneficial for the individual and to the economy.
1 These figures represent the inverse of the ratios shown in Figure 3.
2 These figures use the 1980-1982 Australian Life Tables from the Australian Government Actuary and the 2019-2021 Life Tables from the Australian Bureau of Statistics.
3 Australian Institute of Health and Welfare, Health-adjusted life expectancy in Australia: expected years lived in full health, 2011.
4 Australian Institute of Health and Welfare, Australian Burden of Disease Study, 2022
5 This paper uses 2061 and not 2062 as this is the final year in Treasury’s latest population projections from the Centre for Population.
6 International Labour Organisation, www.ilo.org
7 Treasury, 2021 Intergenerational Report, p36.
8 United Nations, World Population Prospects 2022, Medium variant
9 Treasury, Intergenerational Report 2021, p31
Dr. David Knox is a Senior Partner and Senior Actuary at Mercer Australia. This article is general information and not investment advice, and does not consider the circumstances of any person.