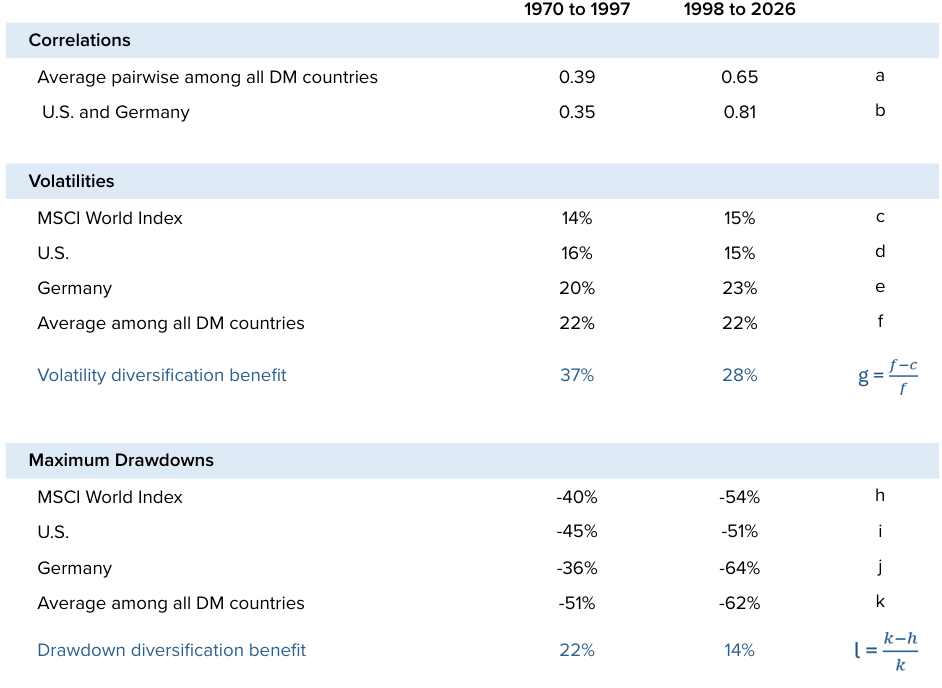
For decades, the world economy became increasingly integrated across product, labor, and capital markets—in a word, globalization. One of the many consequences of globalization was higher cross-market correlations. For example, the correlation between U.S. and German equities rose from 0.35 in the period 1970-1997 to 0.81 in the period 1998-2026.
In recent years, globalization has stalled and we now face the prospect of deglobalization. Nations are erecting barriers to the free movement of goods, labor, and capital across borders. If globalization goes into reverse, we would expect equity markets to decorrelate.
Perhaps counterintuitively, as the world deglobalizes, risk-minimizing investors should respond by making their portfolios as global as possible. A world of less-correlated equity markets is a world in which the benefits of global diversification are higher.
Globalization raised correlations
Globalization was a decades-long process involving falling trade barriers, increased migration, reduction in capital controls, financial liberalization, and regulatory harmonization. Milestones included the fall of the Berlin Wall (1989), NAFTA (1994), China’s entry into the WTO (2001), and the expansion of the EU (2000s).
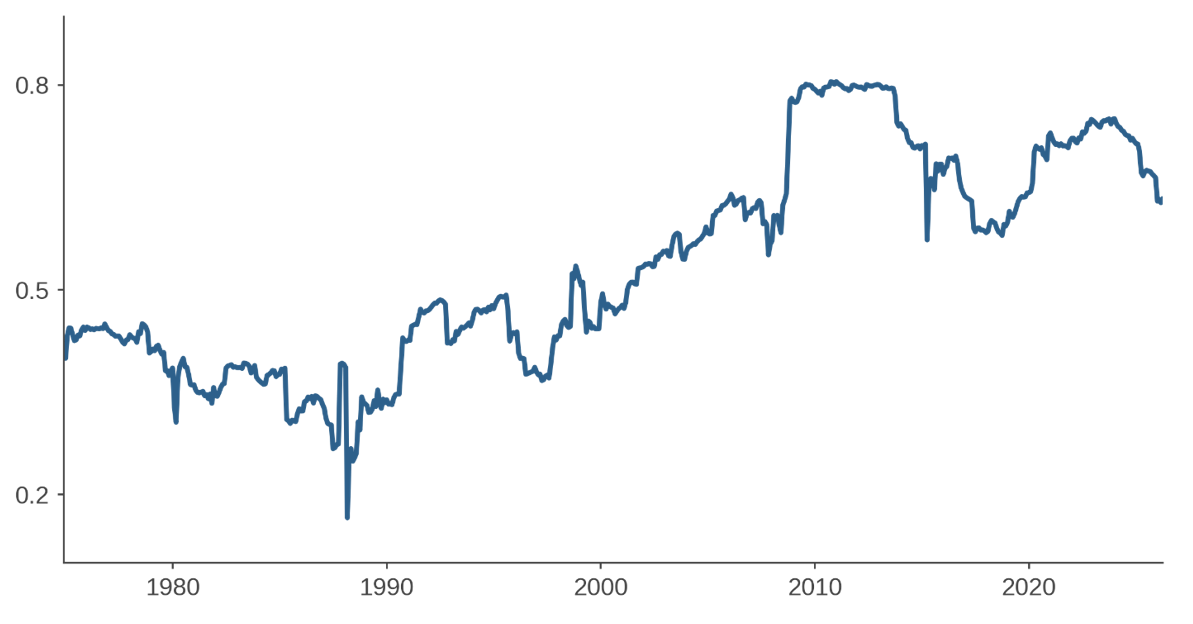
Figure 1 shows the resulting change in cross-country equity correlations from 1970 to 2026. It shows average pairwise correlations of the 23 developed market (DM) countries currently in the MSCI World Index, calculated from trailing 60-month windows of gross USD returns.1 After globalization accelerated during the 1990s, average correlations rose substantially.
The pattern is representative of the broader sweep of history. Looking at global stock returns from 1850 to 2000, Goetzmann, Li, and Rouwenhorst (2005) find that “correlations vary considerably over time and are highest during periods of economic and financial integration such as the late 19th and 20th centuries.”
Globalization seems to have stalled sometime after the Global Financial Crisis (GFC). Significant retrenchments included the Brexit vote (June 2016), Russia’s full-scale invasion of Ukraine (February 2022), and tariffs announced by the Trump administration (April 2025). It remains unclear whether globalization has actually reversed in recent years (‘deglobalization’) or whether it has merely slowed (‘slowbalization’).2
Figure 1: Average DM cross-country correlation
Sources: Acadian Asset Management LLC and MSCI. Average pairwise correlations are calculated using a rolling five-year window of gross total USD returns across DM countries from January 1970 to March 2026. DM reflects countries in the MSCI World Index as of December 31, 2025. MSCI data copyright MSCI 2026. All Rights Reserved. Unpublished. PROPRIETARY TO MSCI. For illustrative purposes only. Past results are not indicative of future results.
Higher correlations, lower diversification benefit
Suppose that, going forward, we see unambiguous deglobalization and the world economy returns to the lower levels of integration observed from 1970 to 1997. What would this world look like?
First, we would expect lower corporate profit growth as the global economy is impacted. Second, we would expect lower cross-country correlations. While there is little that shareholders can do to insulate themselves from weaker fundamentals, they can benefit from decorrelating markets by diversifying as much as possible.
We define the diversification benefit as the reduction in portfolio volatility achieved by holding a diversified portfolio instead of a single country. Under simplifying assumptions, this benefit is a straightforward function of correlation.
Table 1: Benefits of diversification – Developed Market Equities
Sources: Acadian Asset Management LLC and MSCI. Diversification benefit is the percent reduction in risk going from the average to the world. Gross total USD returns across DM countries from January 1970 to March 2026. Sub-periods inclusive of starting and ending years. DM reflects 23 countries in the MSCI World Index as of December 31, 2025. MSCI data copyright MSCI 2026. All Rights Reserved. Unpublished. PROPRIETARY TO MSCI. It is not possible to invest in any index. Past results are not indicative of future results. For illustrative purposes only.
Average developed market correlation rose from 0.39 before 1998 to 0.65 after 1998 (Table 1, row a). This increase implies that the diversification benefit was about 1.9 times greater before 1998 than after 1998.
Table 1 fleshes out this change. Before 1998, the MSCI World portfolio had a return volatility of 14% (row c), 37% lower than the 22% average volatility of its constituent countries (rows f and g). After 1998, the benefit of diversification declined to 28%. While not the full 1.9x implied by the correlations, the earlier period still shows a meaningfully larger benefit (1.3x). 3
Another way to measure diversification is through its impact on drawdowns, which we would expect to be roughly proportional to volatility. Table 1 shows that diversification reduced maximum drawdowns by 22% before 1998 and 14% after (row l). Again, the benefits of diversification were substantially larger in the earlier period (1.6x greater).
Table 1 also highlights results for the U.S. and Germany. Investors sometimes argue that global diversification is useless, and that it is sufficient to hold only U.S. equities. At first glance, the post-1998 data in Table 1 appears to support this claim, since during that period the U.S. had a smaller maximum drawdown (51%, row i) than the world portfolio (54%, row h) and similar volatility.
However, it would be a mistake to hold a portfolio that is 100% U.S. equities. It is not a law of nature that the U.S. always has lower risk than the world index. Before 1997, Table 1 shows the U.S. had drawdowns and volatility that were higher than the world index. Trailing performance can be a misleading guide to the future. For example, before 1998, the country with the mildest drawdown was Germany (-36%, row j). But after 1998, Germany had a drawdown that was worse than average DM country and worse than the world index.
Conclusion
Deglobalization, if it occurs, will produce winners and losers. Which countries will be the winners? We don’t know. The appropriate response, therefore, is to diversify across countries.4
Will deglobalization lead to a collapse of dollar dominance and wild fluctuations in exchange rates? Again, we don’t know. By holding a world portfolio, we diversify across currencies, helping to protect wealth from monetary disruption.
It has been said that diversification is the only free lunch in finance. While the free lunch of global diversification is always valuable, it becomes especially nutritious when markets fragment and correlations decline. If you want to minimize risk, then you should diversify more—not less—when markets decorrelate.
Endnotes
1Similar results are shown in “Polarizing Views: China’s Impact on EM Investing,” Acadian, December 2021.
2See Mohr and Trebesch (2025) for a literature review. Fernández-Villaverde, Mineyama, and Song (2024) argue that deglobalization has already begun while Altman and Bastian (2026) say that “deglobalization is a clear risk, but at least for now, the world’s connectedness is holding steady at a historically high level.”
3The substantial benefit of international diversification prior to 1998 was highlighted by Bergstrom (1975) and Michaud, Bergstrom, Frashure, and Wolahan (1996). In fact, the observation helped to motivate Bergstrom’s founding of Acadian Asset Management in 1986.
4In addition to deglobalization, another source of uncertainty is AI. Which countries will be AI winners? Since we don’t know the answer, the risk-minimizing choice is to hold all countries.
Acadian Asset Management (Australia) Limited (ABN 41 114 200 127) is the holder of Australian financial services license number 291872 (“AFSL”). It is also registered as an investment adviser with the U.S. Securities and Exchange Commission. Under the terms of its AFSL, Acadian Asset Management (Australia) Limited is limited to providing the financial services under its license to wholesale clients only.
This article is provided for informational purposes only. It does not constitute or form part of any offer to issue or sell, or any solicitation of any offer to subscribe or to purchase, shares, units or other interests in investments that may be referred to herein and must not be construed as investment or financial product advice. Acadian has not considered any reader’s financial situation, objective or needs in providing the relevant information.
References
Altman, Steven A., and Caroline R. Bastian. “DHL Global Connectedness Report 2026.” DHL Global Connectedness Report (2026).
Bergstrom, Gary. “A new route to higher returns and lower risks.” Journal of Portfolio Management, Fall 1975.
Campbell, John Y. Financial decisions and markets: A course in asset pricing. Princeton University Press, 2017.
Elton, Edwin J., and Martin J. Gruber. “Risk reduction and portfolio size: An analytical solution.” The Journal of Business 50, no. 4 (1977): 415-437.
Fernández-Villaverde, Jesús, Tomohide Mineyama, and Dongho Song. Are we fragmented yet? Measuring geopolitical fragmentation and its causal effect. NBER Working Paper No. 32638. National Bureau of Economic Research, 2024.
Goetzmann, William N., Lingfeng Li, and K. Geert Rouwenhorst. “Long-term global market correlations.” The Journal of Business 78 (2005): 1-38.
Michaud, Richard O., Gary L. Bergstrom, Ronald Frashure, and Brian Wolahan. “Twenty years of international equity investing.” Journal of Portfolio Management 23, no. 1 (1996).
Mohr, Cathrin, and Christoph Trebesch. “Geoeconomics.” Annual Review of Economics 17 (2025).