Since the financial crisis, the risk/return relationship that underpins the accepted investment wisdom in Australian equities has been challenged. The funds of median smaller company managers are showing lower levels of volatility and price falls in market pullbacks.
This article considers several explanations for the lower risk across smaller company managers and whether we could expect this to continue.
Risk and return of large and small cap median managers
To analyse the different risk/return characteristics of broad cap (ie the entire market) and small cap (ie smaller companies) managers, we have used the monthly median Australian fund manager returns since 1990. Managers are split using the Morningstar classifications of broad cap or small cap from all the available retail funds in the Morningstar database. Using point in time monthly data removes survivorship bias, and all returns are recorded after fees.
Figure 1 below charts the risk/return characteristics of the broad cap manager compared to the small cap manager over multiple time periods. Over longer time periods (10-20 years), the traditional risk/return theory holds. However, over the shorter time period (5 years) the median small cap manager has experienced superior return at lower levels of risk.
Figure 1: Risk and return characteristics of Australian equity funds
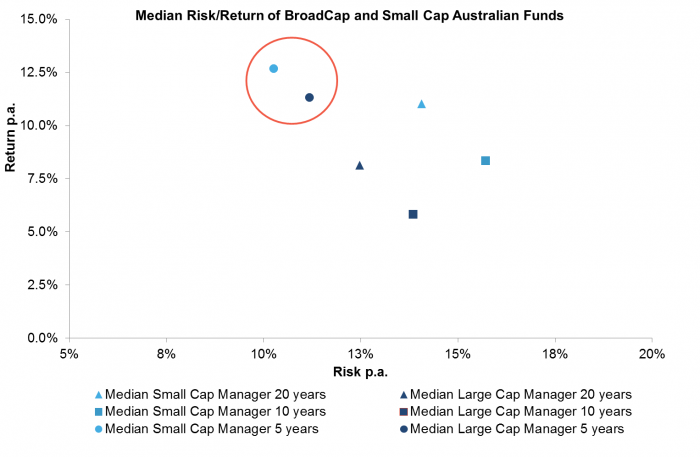
Source: Morningstar, Fidante Partners
Have the risks in larger companies changed?
Whilst volatility should retreat after the generational losses seen in 2007-2009, the volatility of larger company manager portfolios has not reduced at the same pace as smaller company manager portfolios.
Economic sensitivity is generally considered to be higher in smaller companies. This is a reason why these stocks will at times underperform when economic conditions deteriorate. However, analysts may be underestimating the impact on the large end of the Australian stock market from low economic growth due to the sector concentration and the increasing use of new ETF structures that are impacting how large-cap equities are held and traded.
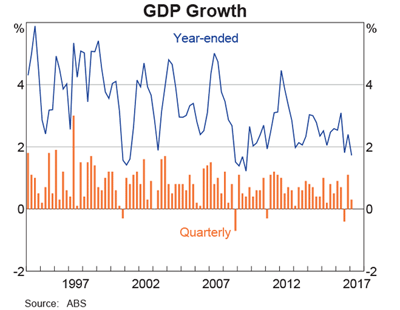
Large companies need economic growth
The long-term growth potential of the stock market is dependent on the level of nominal gross domestic product (GDP). With consumption growth weakened, investments curtailed and the government attempting fiscal prudence, growth has been restrained.
Larger companies especially will more likely proxy and mimic the growth of the broader economy. Larger companies have collectively benefitted on the one hand from falling interest rates and benign cost inflation, however, these benefits are symptoms of a lacklustre growth environment. As proxies for the domestic economy, the aggregate of the larger company market has struggled to achieve strong real organic growth.
For smaller companies, the problem of growth is a different one. Growth rates are more commonly defined by the operational and strategic success of the business. That is not to say that many smaller companies have themselves not had their own challenges, but there generally is more organic growth potential.
Figure 2: Australian GDP
The smaller company market is structurally diversified
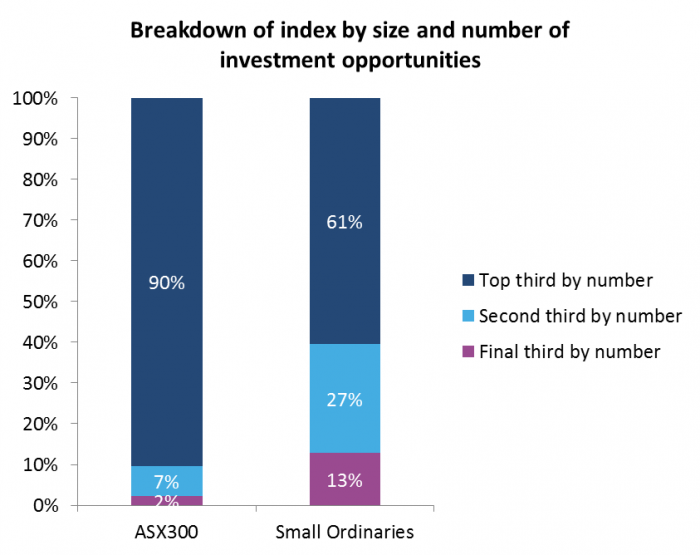
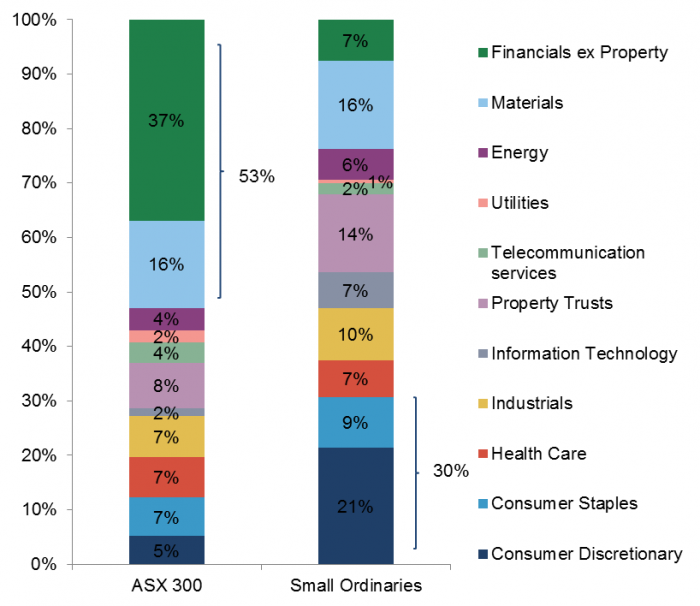
Australian funds management is dominated by a handful of bank financials and resource names comprising over 50% of the S&P/ASX300 index. Whilst an active manager can produce a well-diversified portfolio in Australian larger companies, it necessitates the manager hold a very different looking portfolio to the index.
The concept of index concentration in smaller companies is less, if non-existent, without the stock concentration and sector concentration, as shown in Figure 3. An obvious point maybe, but the smaller company universe has a pressure valve, where concentration risk is reduced as stocks move up and out of the index. Whilst a bubble may have its origins in the smaller company universe, it is likely in the large-cap index where the bubble will take hold and do the most damage.
Figure 3: Composition of Australian broad cap and small cap market indexes as at 30 June 2017
In addition, as investors use of ETFs, thematic factor buckets and other pseudo market proxy strategies increase, a lot of stock trading is largely unrelated to the condition of the underlying instruments. The holding period for many stocks is now measured in days and weeks, which is inconsistent with real investing. Liquidity requirements of ETF structures and the belief in the market proxy disproportionally affects larger companies.
Role in portfolio construction
The analysis of risk-adjusted returns (as measured by the Sharpe Ratio, which is approximately return divided by risk as measured by volatility) of blended small and broad cap median managers shows over the last 20 years, the most efficient portfolio is one which includes 100% smaller companies. This is a theoretical exercise and in practice behavioural biases and preferences of an individual will dictate if an investor can tolerate increased volatility. However, the chart below shows it is possible to incrementally allocate to small caps (below 50%) without meaningfully increasing the overall risk of a blended portfolio.
Figure 4: Portfolio construction: Blending large and small company managers
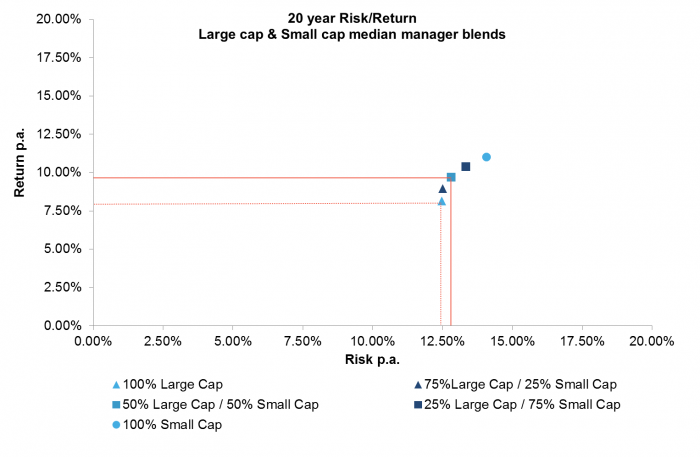
Source: Morningstar, Fidante Partners
For example, in Figure 4, the blue triangle with the lowest risk and return is 100% allocation to large companies. The blue square is 50% large and 50% small companies, with a significantly larger increase in returns than risk, and hence an increase in the Sharpe Ratio.
Over the last 20 years, whilst little has changed in the smaller company market, a lot has changed in the larger company market. The combination of low economic growth, sectoral concentration and the size of the transient short-term trading may require the investor to carefully consider their exposure to smaller companies versus larger companies.
Tim Koroknay is an Investment Specialist at Fidante Partners. Fidante is a multi-boutique asset manager which includes two small companies fund managers, NovaPort Capital and Lennox Capital Partners. Fidante is a sponsor of Cuffelinks. This article is general information and does not consider the circumstances of any individual.