Investment analysts follow the flow of funds into different assets or structures as a guide to investor behaviour, and a potential signal on the direction of markets. Strong inflows into equity funds might show buying confidence and optimism that prices will rise further. The inflows may generate additional investments. The same arguments are made in reverse for outflows.
However, flows do not always lead markets in the same direction, such as when strong and rising markets are perceived as overvalued, or when funds are forced to rebalance out of the strongest sector if its rise has pushed an allocation above a threshold level. Investors may be required to sell the winners.
Four recent Australian reports provide insights into different aspects of investor behaviour.
- Calastone on managed funds flows
- Plan for Life on platform and wrap flows
- Morningstar on ETF flows, returns and balances
- Investment Trends client flows reported by advisers
1. Calastone on Australian managed funds
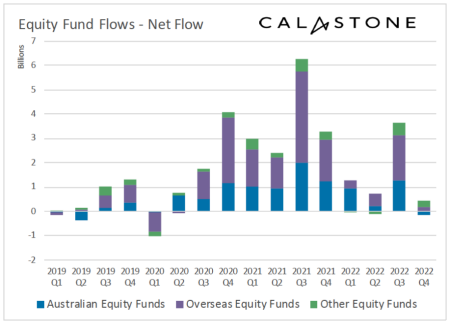
The headlines for Australia are that uncertainty caused by inflation and higher interest rates reduced inflows into all asset classes in 2022 versus prior years. Fixed income fund inflows shrank 95% and equity fund inflows fell by about 60% in 2022 versus 2021. Active equity fund inflows fell an even higher 74%, and Q4 saw the first outflows from domestic equity funds since the onset of pandemic. Calastone, which sees over 95% of Australian managed fund flows across its network, reports:
“2022 saw investors add far less cash to their managed equity funds – down 62% to A$5.74bn, though this decline was from the exceptionally high level seen in 2021. The drop in the net inflow was driven much more by a dearth of buyers (orders fell by 15%) than an increase in selling (orders rose only 7%) ... the large decline in the net inflow indicates much greater uncertainty in 2022 among investors over the likely direction of equity markets.
The third quarter accounted for almost two thirds of the year’s net inflow as Australians bought heavily into the bear market rally in July … they became much more negative and net inflows fell to just A$296m in Q4 in consequence … In October and December investors were net sellers of equities.”
Net fund flows across selected equity categories, all AU domiciled
Investors allocated heavily into fixed income funds until the end of 2021 when interest rates were low, then redeemed in Q2 2022 on the back of capital losses. This was not good timing as rates rose over the first half of 2022. By October 2022, sentiment had improved again, and investors added $824m to their bond holdings in the fourth quarter. Over the full year, net inflows to fixed income funds were down from $10.5 billion in 2021 to only $562 million in 2022.
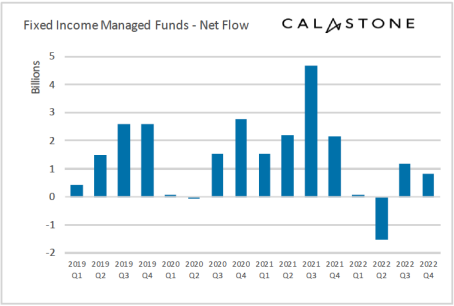
Calastone concluded for the end of 2022:
“Indeed, the much greater loss of confidence in equity funds in the fourth quarter compared to fixed income suggests investors are looking at bond funds as a relative safe haven. Q4 was the first time since Q1 2020 that fixed income funds have attracted more cash than equities.”
2. Plan for Life on platforms in Australia
Plan for Life collects data on funds held in wraps, platforms and master trusts based on balances rather than flows. As the Calastone data showed, 2022 was a more difficult year compared with 2021 with wraps down 3.6% to $518 billion but platforms and master trusts both fell more.
Notably, Plan for Life data is not itemised by asset class but by the name of the provider, and at the top is Insignia, the new brand for IOOF which bought the MLC business to catapult it to the pinnacle. Familiar names such as BT, AMP, Commonwealth and Macquarie follow, but the big gainers over recent years are the newer wraps, netwealth, HUB24 and Praemium. While the other businesses have seen declining FUM, these 'managed account' platforms are grabbing market share.
With the strong media and investor focus on Exchange Traded Funds (ETFs) and Listed Investment Companies (LICs), it is easy to think that these platform products are less relevant. However, with $920 billion in balances, they dwarf ETFs at about $135 billion and LICs around $48 billion as at 31 December 2022.
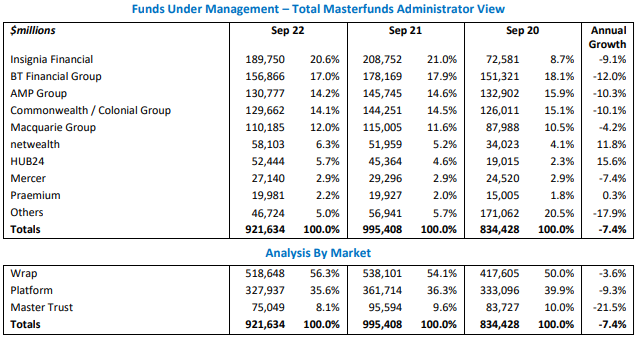
Source: Plan for Life
3. Morningstar Australian ETF Report
Morningstar recently started producing a comprehensive ETF report showing:
- Exhibit 1 (Page 2) consists of static information - inception date, the ASX code, a strategic beta flag, and fees. It includes net assets (funds under management as of 31 December 2022, where available), net flows (sum of net monthly flows over 12 and 36 months, where available), and the live Morningstar Analyst Rating at quarter end.
- Exhibit 2 (Page 9) consists of the performance as measured by trailing returns over varying time periods, the average monthly premium/discount over the past quarter, and portfolio statistics (where available) like total number of holdings and % exposure of the fund in the top 10 holdings.
This quarterly report will be published in the Firstlinks’ Education Centre as it is updated. It is an excellent resource to see not only performance, but funds flows and total balances.
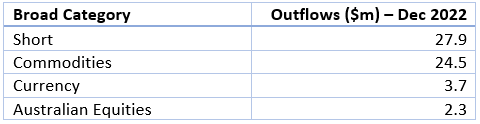
The broad category Australian-domiciled ETF flows for 2022 were:
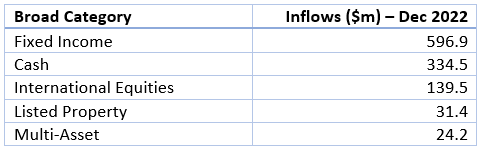
Some highlights in the December 2022 Report:
- The vast range of fees. Passive or index ETFs are relatively cheap and, in some cases, almost free, but active ETFs are usually no cheaper than their managed fund equivalents. Investors should not think that ETFs equal low management fees.
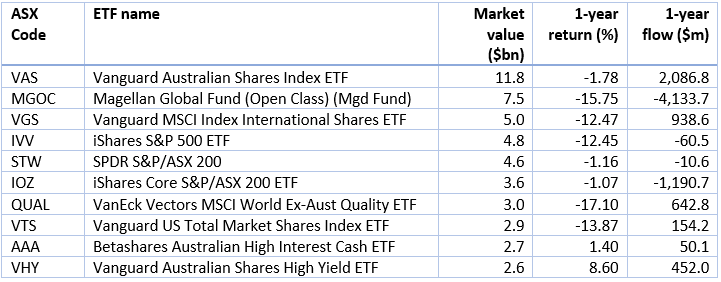
- The largest ETFs in Australia as at 31 December 2022 were:
- Reflecting a year of extremes, there is a remarkable range of 1-year performance across the 319 ETFs offered on the ASX and Cboe exchanges. Highs include Global X Ultra Short Nasdaq 100 Hedge Fund (ASX:SNAS) at +79.5%, Betashares US Equities Strong Bear Hedged (ASX:BBUS) +45% and Betashares Global Energy Companies (ASX:FUEL) +40.2%. The lows include Betashares Crypto (ASX:CRYP) -81.2%, Global X Ultra Long Nasdaq (ASX:LNAS) -69.9%, Montaka Global (ASX:MKAX) -48.2% and Betashares Geared US Equities (ASX:GGUS) -47%. There was even a bond fund, the Betashares Global Gov Bond 20+ year (ASX:GGOV) that lost 31.3%. If buying last year's losers and selling previous winners is a strategy, there is plenty of choice.
4. Investment Trends on client inflows
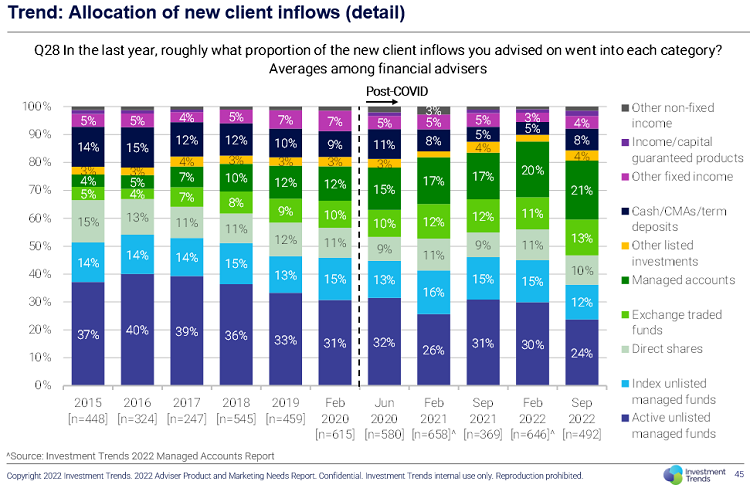
Investment Trends regularly surveys financial advisers on their client flows, and the chart below shows advisers are major supporters of unlisted managed funds, although significantly less in 2022 (36%) than prior years (51% in 2015 and 45% in 2021). Categories which are gaining are managed accounts and ETFs.
Next week, we will focus specifically on changes in SMSFs.
Graham Hand is Editor-At-Large for Firstlinks. This article is general information and does not consider the circumstances of any investor.