An important change has hit the ASX listed bank hybrid market recently that we think may lead to a contraction of margins on listed hybrids for the remainder of the year.
Since the drafting of Basel III regulations in 2010, bank hybrid structures had been shunned by institutional investors who refused en masse to accept the so-called ‘non-viability’ clauses embedded in Basel III complying hybrid structures. The non-viability clause allows the regulator to convert the hybrid to equity to improve a bank’s solvency under crisis conditions. Such a clause has obvious risks, which retail investors either overlooked or ignored, while institutions thought it gave the issues too much ‘equity’ characteristic without sufficient return.
A flagship Tier 2 capital issue by Bendigo & Adelaide Bank in January 2014 saw institutional investors participate for the first time under the new bank capital regime. Westpac, ANZ and IAG have all issued into the wholesale over the counter (OTC) market to institutional investors since.
The institutional dislike of the 'non viability' clause relates to the absolute ability of APRA to exercise its option to convert capital instruments. To date, APRA has given no guidance as to when it will exercise this ability and has told banks that “we will know a non viability scenario when we see it”. It’s not totally clear what the reasons are for the recent change of mind by institutional investors, and it may include the still attractive margins or fewer fears about the global banking system. It hasn’t been guidance from APRA about when it will use the 'non viability' clause.
We believe that the change in institutional investor sentiment has the potential to squeeze supply for the retail ASX listed market for the rest of 2014.
Maintenance of 3% margins since the implementation of Basel III
A few months ago, we thought the listed hybrid market would produce a total return this year close to 6% (including franking). However, due to the changed sentiment of institutional investors in the wholesale OTC market, there now appears potential for spread contraction and capital growth in prices in the listed hybrid market. Absent another equity market crisis or major event shock, we think that listed major bank issues are unlikely to attract a margin of greater than 3% again (the margin is paid above the bank bill rates, currently below 3%, and adjusted for franking).
The chart below shows margins on US corporate BBB and BB debt and the composite margin of ASX Listed Major Bank Hybrids. The zero cash rate in the US has driven investors into higher-yielding assets since the GFC and margins on BBB and BB corporate debt are close to 1996-2006 levels, half their late 2009 levels. However, margins on the ASX Listed Major Bank Hybrids are largely unchanged, having fluctuated around 3% for the past four to five years. They were recently higher than US BB corporate debt for the first time ever.
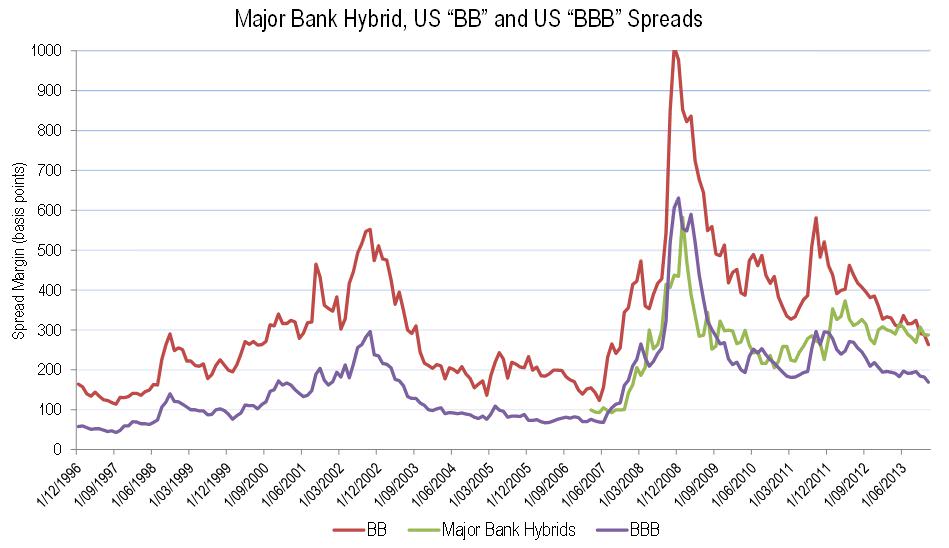
Data: Bloomberg, ASX and Elstree
Major bank hybrid margins have been relatively flat due to a massive amount of supply as banks began to comply with the much more restrictive Basel III capital regime. In absolute terms, the market size has doubled since late 2011. Prior to the GFC, the market used to absorb about $3 billion on an annual basis. The chart below shows gross and net (after allowing for redemptions of issues) since 2007. The net issuance amount is probably the best guide to supply/demand equations.
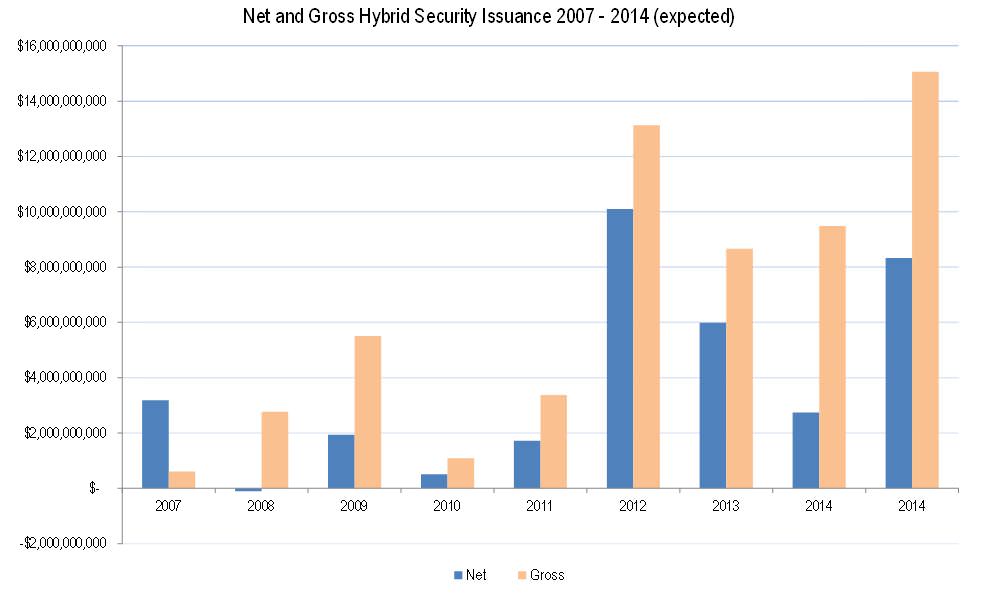
Data: ASX and Elstree
The year 2012 was characterised by about four years of normal issuance while 2013 was about 3 years of normal issuance. Until recently, we expected that 2014 would produce about $8 billion in net issuance or $15 billion in gross issuance. The two bars for 2014 show two outcomes: the first assumes that banks refinance all their Tier 1 hybrids in the ASX market and the second adds another $6 billion of Tier 2 debt that banks need to finance. Financing $15 billion of gross issuance would mean that margins would remain high.
Institutional demand will impact directly on ASX listed issuance
The institutional acceptance of the ‘non viability’ clause in Basel III compliant transactions stems from a broad-based change in sentiment toward banks in general.
A recent issue in Europe by UBS for example was five times oversubscribed, and was issued at a record low margin. Australian banks could now issue Tier 2 capital instruments at margins well under the current trading margins of ASX listed hybrids. If the Australian bank issuers tap the international market and local institutional investors continue to follow their international contemporaries into the market then the level of net issuance in the ASX listed market could potentially fall to the level last experienced in 2006.
Unless there is a sudden reversal, institutional investors are now most likely to absorb the $6 billion of Tier 2 debt that the Australian banks need to issue this year. The chart below shows the proportion of hybrid issue ownership by the top 20 holders for each issue, grouped by years of issue. In recent years, the Top 20 (i.e institutional) investors have held as little as 20% or less of some issues, showing a high percentage of small retail investor participation, with around 40% of some issues owned by investors with less than $50,000 holdings. Investors will buy anything with the margins higher than 3% recently.
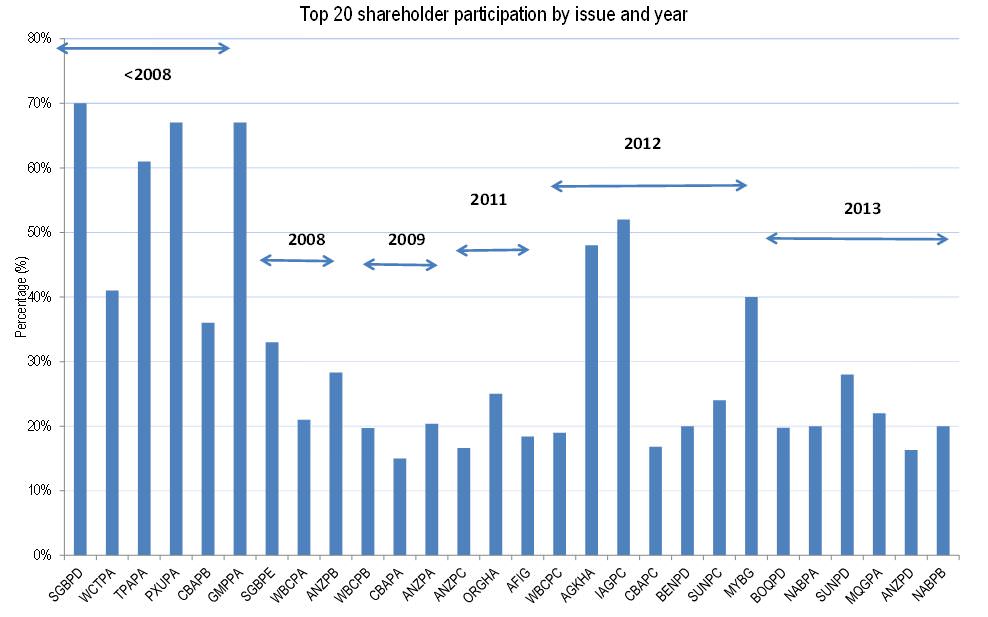
Data: Elstree and ASX.
Retail and SMSF support
In 2011, bank term deposits were readily available at rates of 6% or higher. In 2012 they were still around 5%. Driven by the volatility of equity markets, SMSF holdings of cash, including term deposits, doubled from around $70 billion in 2007 to $150 billion in 2013.
As the cash rate is now down to 2.5% and term deposits of less than 12 months are prefixed with a ‘3’ the loss of purchasing power after adjusting for inflation is causing concern among retirees. Unlike their institutional brethren, retail investors have been comfortable since the implementation of Basel III with the major bank name hybrids, and were willing to overlook the complex regulatory clauses and risks in search of total returns in excess of 6%.
Although official statistics on SMSF investments are dated and too aggregated, there are signs in the 2013 statistics of an absolute fall in cash holdings, despite total SMSF funds increasing rapidly. There is a lag between new term deposit rates falling and cash flows, but any term deposits that were written in 2012 at rates of 5% or above will now be rolling at around 3.5%. We estimate that as little as a 2% reallocation by SMSF trustees from term deposits to hybrids will account for all the expected net new issuance in the listed hybrid market this calendar year.
If institutional demand in the OTC market soaks up the bank Tier 2 issuance, there will be a shortage of ASX listed hybrid supply at the time when a decent chunk of the $150 billion in SMSF monies invested in term deposits is looking for a new home.
Campbell Dawson is a Director of Elstree Investment Management Limited. Information and opinions contained in this article should not relied upon as authoritative and may be subject to change without notice.