Register For Our Mailing List

Register to receive our free weekly newsletter including editorials.

Home / 248

A better way to measure Australian small caps

In a quest to diversify portfolios from the concentration biases found in the large cap Australian equities market, investors often allocate a defined (and usually static) weight to Australian small cap investments. This intuitively makes sense, because we expect to achieve superior diversification by investing outside the large cap stocks, and because of the belief smaller companies will have stronger earnings growth opportunities.

But these views may be flawed.

The small cap index is a dud index

Over the long term, the small cap index has underperformed the large cap index by around 2.8% p.a. (since 1990) and has done so with 25% higher risk. That’s not to say there are not significant opportunities in small caps from time to time, with the performance differentials between small and large cap significant over the short term. Actively managing the rotation in and out of the small cap market should be a consideration, and timing is important.

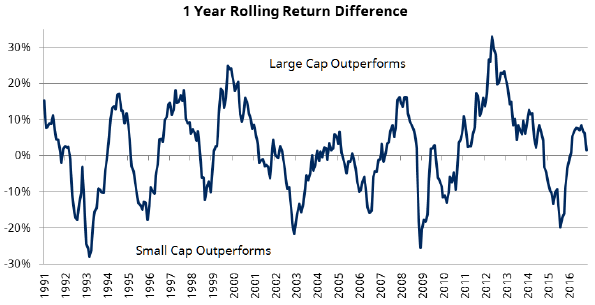
Source: Schroders, Global Financial Data. Returns from 1 Jan 1990 for S&P/ASX Small Ords and S&P/ASX 200 (All Ords before 1/4/2000).

The index construction that provides risks and opportunities

In Australia, the lack of a mature venture capital industry results in listing rules that do not consider a business’s profitability or financial viability, unlike in other global markets. There are times where our market is built around a large number of no-revenue or no-profit generating mining companies. For small cap equity managers, when one of the most effective portfolio construction methods is to avoid the losers, is it reasonable to pay an active or performance fee based on this market anomaly?

Our belief is that while the average active manager in Australian small caps has been able to outperform the index, this is due in a large part to the inefficiencies in the index construction. On average, small cap managers earn a fee 60% higher than that for large cap portfolios. While at a base fee level there is some justification for this given the relative size of assets that can be managed in each market cap segment, we would suggest investors should be wary of the potential for large performance fees to be accrued versus the poorly-constructed small cap index.

A broad-cap flexible approach should be adopted

Valuation is a strong indicator of future returns and this belief is supported by analysis of starting point Price to Earnings ratios (P/E) and the subsequent 3-year performance, as shown below.

There is a distinctive trend towards higher valuations in small caps leading to subsequent underperformance relative to large cap. Interestingly, higher valuations in large caps don’t necessarily lead to underperformance of small caps. At present, small cap P/Es are relatively high compared to history (at 18.7x) and higher than the large cap market.

It makes sense for investors to explicitly consider the valuation differences between small and large cap stocks in making their investment allocations. Not all investors have the skill and tools to either monitor the timing of asset allocations or the ability to change the investments. We believe the decision and implementation for actively managing Australian equities is best made by a broad-cap investment manager with skills to understand when the opportunity is right across the full market cap spectrum (large, mid, small and micro-cap sectors). This ensures stock specific ideas can be prioritised rather than esoteric ideas coming from a specific cut off point in a benchmark.

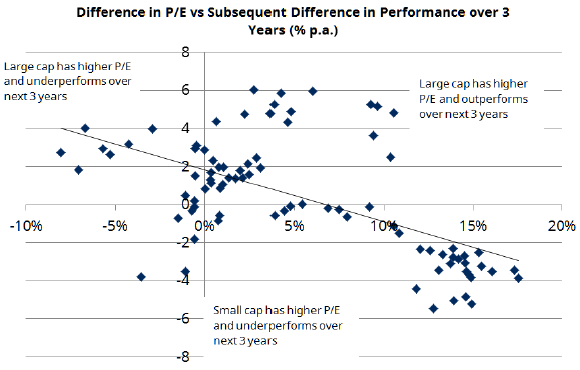
Source: Thomson Reuters Datastream, Global Financial Data, Schroders Analysis

Benchmarks and active management

An objective look at the opportunities presented across the small and large cap markets suggests that segmenting the allocation by market cap (as defined by some arbitrary stock number) isn’t necessarily the best way for investors to manage their portfolio. Investors may wish to consider a bias toward smaller caps to take account of the greater economic diversity from this part of the market. However, an alternative broad-cap exposure is a different way to structure a client’s aggregate equities exposure versus separate small and large cap portfolios.

We conclude that:

  • The small cap index is poorly constructed and suffers from significant structurally lower long-term performance, higher risk, and poorer earnings growth characteristics.
  • Active management of this part of any Australian equity exposure is both essential and rewarding.
  • The appropriate benchmark against which performance should be measured and fees calculated is a broader market index or the large cap index, rather than a specifically small cap index as this is more representative of the opportunity set and removes the bias created by an arbitrary index cut-off.
  • The performance differentials between small and large cap stocks, while biased in favour of large cap, have shown significant historical variability and this represents a greater opportunity for investors with broad-cap research capabilities to add value.


Greg Cooper is Chief Executive Officer at Schroders Australia. This article is in the nature of general information that does not consider the circumstances of any individual.


Leave a Comment:

RELATED ARTICLES

Small caps v large caps: Don’t be penny wise but pound foolish

Australian large caps outperform small caps over long term

Buy the dips?

banner

Most viewed in recent weeks

Australian house prices close in on world record

Sydney is set to become the world’s most expensive city for housing over the next 12 months, a new report shows. Our other major cities aren’t far behind unless there are major changes to improve housing affordability.

The case for the $3 million super tax

The Government's proposed tax has copped a lot of flack though I think it's a reasonable approach to improve the long-term sustainability of superannuation and the retirement income system. Here’s why.

7 examples of how the new super tax will be calculated

You've no doubt heard about Division 296. These case studies show what people at various levels above the $3 million threshold might need to pay the ATO, with examples ranging from under $500 to more than $35,000.

The revolt against Baby Boomer wealth

The $3m super tax could be put down to the Government needing money and the wealthy being easy targets. It’s deeper than that though and this looks at the factors behind the policy and why more taxes on the wealthy are coming.

Meg on SMSFs: Withdrawing assets ahead of the $3m super tax

The super tax has caused an almighty scuffle, but for SMSFs impacted by the proposed tax, a big question remains: what should they do now? Here are ideas for those wanting to withdraw money from their SMSF.

The super tax and the defined benefits scandal

Australia's superannuation inequities date back to poor decisions made by Parliament two decades ago. If super for the wealthy needs resetting, so too does the defined benefits schemes for our public servants.

Latest Updates

Planning

Will young Australians be better off than their parents?

For much of Australia’s history, each new generation has been better off than the last: better jobs and incomes as well as improved living standards. A new report assesses whether this time may be different.

Superannuation

The rubbery numbers behind super tax concessions

In selling the super tax, Labor has repeated Treasury claims of there being $50 billion in super tax concessions annually, mostly flowing to high-income earners. This figure is vastly overstated.

Investment strategies

A steady road to getting rich

The latest lists of Australia’s wealthiest individuals show that while overall wealth has continued to rise, gains by individuals haven't been uniform. Many might have been better off adopting a simpler investment strategy.

Economy

Would a corporate tax cut boost productivity in Australia?

As inflation eases, the Albanese government is switching its focus to lifting Australia’s sluggish productivity. Can corporate tax cuts reboot growth - or are we chasing a theory that doesn’t quite work here?

Are V-shaped market recoveries becoming more frequent?

April’s sharp rebound may feel familiar, but are V-shaped recoveries really more common in the post-COVID world? A look at market history suggests otherwise and hints that a common bias might be skewing perceptions.

Investment strategies

Asset allocation in a world of riskier developed markets

Old distinctions between developed and emerging market bonds no longer hold true. At a time where true diversification matters more than ever, this has big ramifications for the way that portfolios should be constructed.

Investment strategies

Top 5 investment reads

As the July school holiday break nears, here are some investment classics to put onto your reading list. The books offer lessons in investment strategy, financial disasters, and mergers and acquisitions.

Sponsors

Alliances

© 2025 Morningstar, Inc. All rights reserved.

Disclaimer
The data, research and opinions provided here are for information purposes; are not an offer to buy or sell a security; and are not warranted to be correct, complete or accurate. Morningstar, its affiliates, and third-party content providers are not responsible for any investment decisions, damages or losses resulting from, or related to, the data and analyses or their use. To the extent any content is general advice, it has been prepared for clients of Morningstar Australasia Pty Ltd (ABN: 95 090 665 544, AFSL: 240892), without reference to your financial objectives, situation or needs. For more information refer to our Financial Services Guide. You should consider the advice in light of these matters and if applicable, the relevant Product Disclosure Statement before making any decision to invest. Past performance does not necessarily indicate a financial product’s future performance. To obtain advice tailored to your situation, contact a professional financial adviser. Articles are current as at date of publication.
This website contains information and opinions provided by third parties. Inclusion of this information does not necessarily represent Morningstar’s positions, strategies or opinions and should not be considered an endorsement by Morningstar.