This article describes how commodities prices affect Australian stock market returns. My focus is not on how the price of one commodity like iron ore affects a particular stock such as Rio or Fortescue, but how commodities prices in general have affected overall returns from the broad stock market over many decades.
Everything we eat, wear, read, sit on, drive, ride, communicate with, and use in our lives every day is made by companies using commodities – crops, livestock, energy, minerals, metals, timber, etc. Commodities prices have cyclical impacts on corporate revenues, earnings and share prices.
The commodities price factor described here is one of several factors used in my fundamental multi-factor, multi-time frame process that is used to make asset allocation decisions.
Focus on changes in the rate of change
What happens to commodities prices is related to subsequent returns from the overall stock market. It is not the level of commodity prices (ie high or low) or changes in prices (direction) that are important, but changes in the rate of change in commodities prices (ie changes in direction) that are related to subsequent equity returns.
My analytical process requires the relationship to have worked for at least 50 years over many different types of market conditions, so I use the Reuters-Jeffreys CRB index. It measures prices of a broad basket of commodities and the composition of the basket changes to reflect changes in global commodity usage and importance.
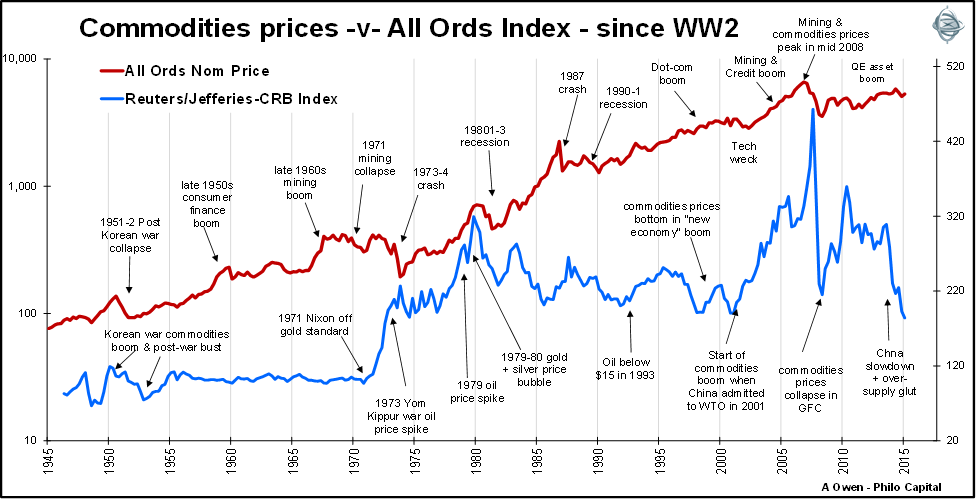
The above chart shows the commodities price index and the Australian stock market index since WW2.
The more recent swings in commodities prices are the late 1970s oil spike and gold/silver bubble, the 2000s China-led mining boom and bust, the GFC price collapse and rebound, and the current price slump caused by the China slowdown and global over-supply in virtually all commodities. These big commodities boom-bust cycles are when the commodities factor in my analysis generates the strongest signals for subsequent stock market returns.
The commodities price factor works best when used in the short term (within 1 year) outlook models for the broad stock market.
How my modelling works
In my model, it doesn’t matter whether commodities prices are high or low, nor whether they are rising or falling. What matters is changes in the rate of change of commodities prices. For example, if prices having been rising (or falling) steadily for a while, investors get used to this and price their expectations of ‘more of the same’ into share prices. But when the rises (or falls) suddenly accelerate or decelerate this changes investor expectations and accelerates the buying or selling of shares.
Slowing rates of commodity price growth (or decelerating rises) are usually followed by relatively low equity returns:
- Investors price in lower export prices and revenues
- Foreign investors lose their interest in Australian shares (not just mining related stocks)
Rising rates of commodity price growth (or decelerating falls) are usually followed by relatively high equity returns:
- Investors price in higher export price and revenue growth
- Foreign investors are more attracted to Australian stocks.
Forecast excess returns using this factor
The following chart shows quarterly forecast excess returns (above prevailing cash rate) from this factor since 1960.
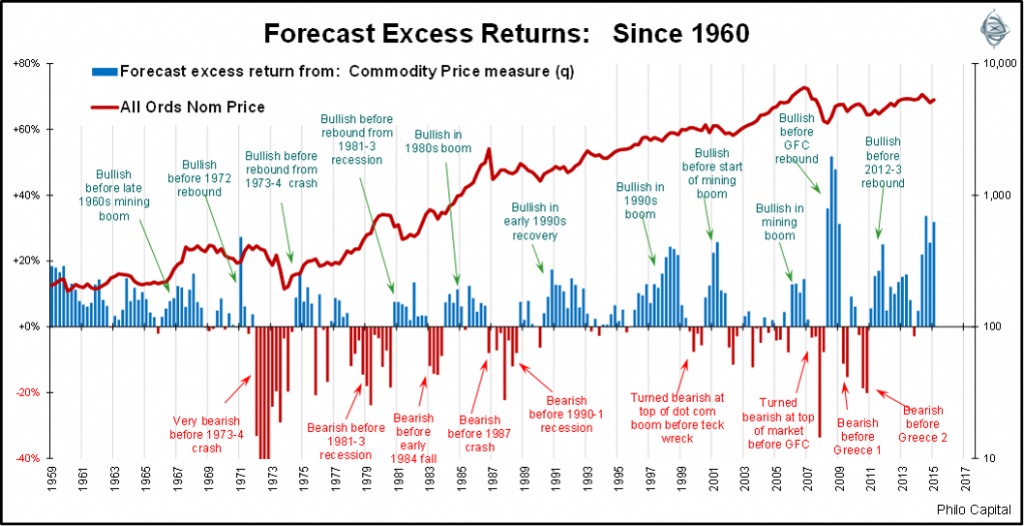
This factor has worked well by providing warning signals before the biggest stock market downturns and upturns. The biggest negative signals (lowest red bars) were immediately before the 1973-1974 stock market crash and before the 2008-2009 sub-prime crash.
It has also worked well through most of the other less severe upswings and downturns, even in cycles that did not involve mining booms or busts.
Like the other factors used in the models, the commodities price factor will often generate small positive or negative signals (short blue or red bars in the chart), for example, the small signals during the middle stages of the 2003-2007 boom. These small signals provide no information to the process and in these cases at least one of the other factors in the model are usually providing more meaningful signals as they measure different aspects of the overall market environment. What I am looking for is big positive or negative signals and these big signals have provided reliable outlooks for subsequent returns from the broad stock market.
The next chart is the same as the last (forecast return above the prevailing cash rate) but in more detail since 2000.
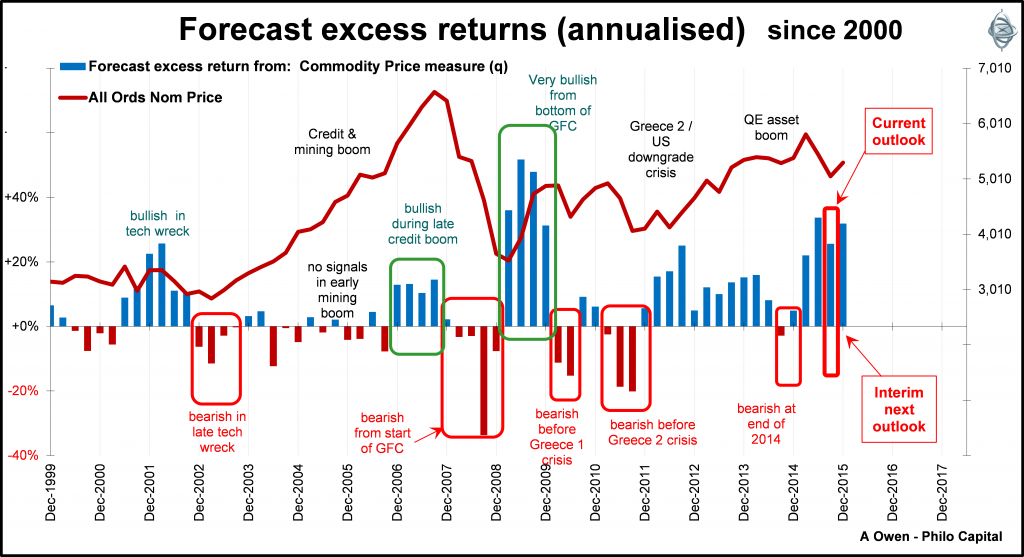
This factor was bullish during the middle and late stages of the 2000s boom then turned bearish at the end of 2007, at the start of the downturn. It then turned extremely bullish right at the bottom of the GFC before the big 2009 rebound. It was bearish before the 2010 Greece crisis and again before the 2011 Greece 2 crisis.
Current position
The short term outlook from this factor is currently bullish.
It's more common to believe that because commodities prices have been relatively low and falling further recently, this would be bearish for shares prices. But not necessarily so. What is important is the changes in the rate of change in commodities prices, not the level or direction.
The factor lost its bullishness in late 2014 but only mildly and briefly, indicating two things. First, it was not bullish for shares in 2015. Second, the stock market pause or decline in 2015 would probably not be sustained or serious (unlike the big and sustained bearish signals before and during the tech wreck, the GFC, Greece 1 and Greece 2). The factor has been bullish from mid-late 2015.
Warning
The commodities price factor described here is only one of the several factors used in our short term outlook for Australian shares. Often the different factors provide conflicting signals because they are measuring different aspects of the overall capital markets environment.
In addition to the several factors in the short term models, I also use several 3 year medium term cyclical factors and also factors in the long term 7-10+ year fundamental pricing models in arriving at the overall outlook. As Australian shares is just one asset class in multi-sector portfolios, I also use a range of processes to determine outlooks for the other asset classes. All these factors are taken into account when making asset allocation settings in portfolios.
For those requiring more detail, a brief outline of the process is attached here.
During 2016, I will write a series of articles further describing the factors I consider in my models and asset allocation techniques.
Ashley Owen is Joint CEO of Philo Capital Advisers and a director and adviser to the Third Link Growth Fund. This article is for general education only and is not personal financial advice. It does not consider the financial circumstances of any individual.