An equal weighting investment strategy is different from traditional market capitalisation approaches. Equal weighting, as the names suggests, treats all the companies the same, equally weighting them so big swings in one company can’t skew the index.
By way of contrast, in market capitalisation indexes, companies which make up the index are included in amounts that correlate to their total market capitalisation. The bigger the company, the bigger the proportion it represents of the index.
Most of the equity indexes quoted in the media are market capitalisation indexes, for example, the S&P/ASX 200 Index is a market capitalisation index. Moreover, the S&P/ASX 200 index is one of the most concentrated sharemarket indexes in the world. The largest 10 companies represent over 45% of the index.
This means that big-company constituents can shift the index more than little ones. This is great when those big companies are on the way up, but not so great when they are on the way down or have limited potential for growth.
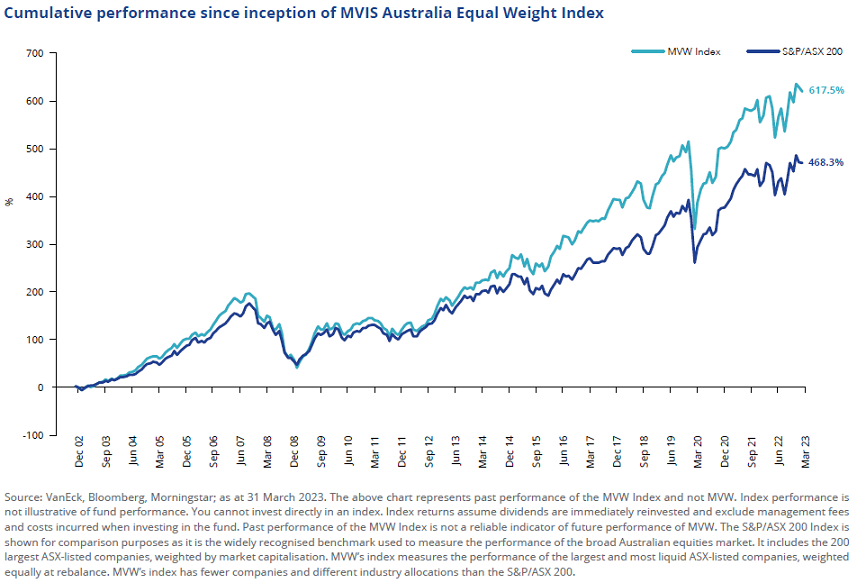
Equal weighting offers an alternative method to investors and they have historically outperformed their market capitalisation counterparts over the long term. The following chart demonstrates this, though we always caution, past performance cannot be relied upon for future performance.
This chart shows the performance of Australia’s standard equal weighted index, the MVIS Australia Equal Weight Index against Australia’s standard market capitalisation weighted index, the S&P/ASX 200 Index (S&P/ASX 200).
In various studies it has been shown that equal weighting performs well because of the following reasons:
- Higher exposure to smaller stocks rather than larger stocks
- Higher exposure to so-called ‘value stocks’ meaning those stocks with a high book-to-market ratio, and
- Better market timing as equal weighting extracts more returns when markets are rising and loses less when markets are falling.
1. Higher exposure to smaller stocks
An equal weight approach provides greater diversification by reducing concentration risk both at an individual stock level and a sector level.
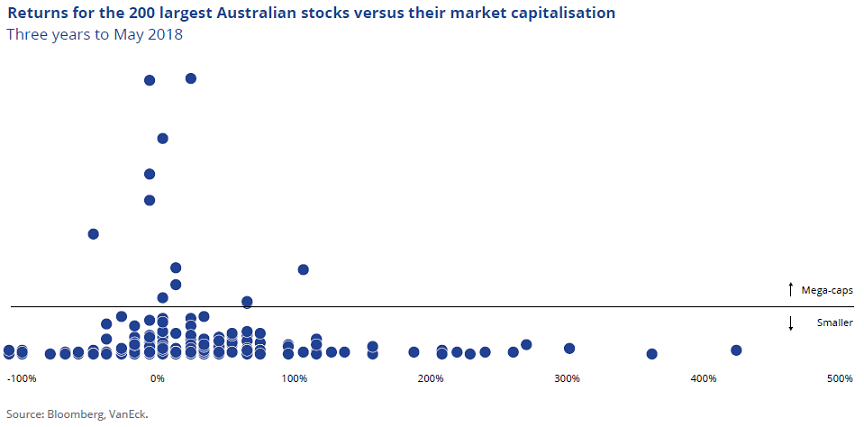
A mathematical analysis demonstrated that equal weighting outperformed because of its greater exposure to smaller stocks, which outperform larger stocks. The word ‘smaller’ was used in the analysis with its precise meaning as a relative term. There was no suggestion that the stocks referred to in the paper were small aps. Rather, these are stocks smaller than those mega-caps who, because of their size, dominate market capitalisation indices.
The mathematical analysis in Why Equal Weighting Outperforms: The Mathematical Explanation showed that the returns from the larger caps are more narrowly distributed than their ‘smaller’ peers so never deliver the very high returns that will be generated by some of the smaller stocks (the paper uses the top 12 to represent the ‘larger’ stocks). You can see this in the figure below, taken from the paper.
We recently highlighted how this is relevant during periods of market recoveries in The road to recovery (revisited): Further analysis of equal weight performance after market declines.
2. Higher exposure to value stocks
Rebalancing an equal-weight index also injects a mild value tilt into the portfolio. In order to maintain its desired weights, the strategy will sell shares that have appreciated relative to their target weight and use the proceeds to buy those that have declined since the previous rebalance.
By assigning the same weight to each constituent, the equal weight index is simply tilting toward stocks with smaller market capitalisations and lower valuations, which have historically outperformed their larger and more expensive counterparts. Mechanically shifting assets away from companies that have become more expensive and toward those that are now cheaper can be an advantage when the market’s valuation reaches extremes (either too expensive or too cheap).
According to research from Plyakha, Uppal and Vilkov[1] the higher systematic return of the equal-weighted portfolio arises from its higher exposure to the market, size, and value factors.
3. Better market timing
Research by Lajbcygier, Chen and Dempsey (2015)[2] analysing US data over a period of nearly 50 years found that equal-weighted indexing had a statistically significant positive bi coefficient, meaning that it is able to systematically ‘time’ the market by outperforming in down markets.
In Australia, the universe of companies is too small and too concentrated and there is a lack of variability over time. A concentrated market limits stock diversification and means investors potentially overlook the stronger opportunities among smaller companies.
Equal weighting offers investors a strategy that has historically outperformed market-capitalisation indexes over the long-term. The choice to equally weight also helps risk management and better diversify, avoiding overexposure to any single name.
Cameron McCormack is a Portfolio Manager at VanEck Investments Limited, a sponsor of Firstlinks. This is general information only and does not take into account any person’s financial objectives, situation or needs. Any views expressed are opinions of the author at the time of writing and is not a recommendation to act.
For more articles and papers from VanEck, click here.
[1] Why Does and Equal-Weighted Portfolio Outperform Value- and Price Weighted Portfolios?, Plyakha, Raman Uppal and Grigory Vilkov January 31 2012
[2] Lajbcygier, Paul & Jeremy Sojka, 2015, “The viability of alternative indexation when including all costs” CSIRO Monash Superannuation Research Cluster, Working paper series