Typically, bear markets have four stages.
Stage one is recognition. Almost everybody shrugs off a bear market’s initial slide as being an ordinary event. The markets rise, and they fall. Treating every bad week as the bear’s arrival would not only shred one’s nerves, but would cause poor performance, should the investor act upon that instinct. Nine times of out 10, realising a quick 5% or 10% loss would result in a permanent 5% or 10% loss, as stocks quickly return to their previous level.
This coronavirus-driven market achieved stage one during its third week. Stocks were up slightly for the year, before suddenly dropping 11% in the last week of February 2020. In response, advisory firms issued reassuring notes about how these things happen, and market volatility is natural. The stock market surged the following Monday, failed to hold its gains, and then collapsed in week three. The bear was on.
Stage two is panic. This occurs when shareholders realise that the standard advice failed. Buying on the dip wasn’t easy money, as it is nine times in 10. Rather, it led to greater damage. Along with the pain (and regret) of unexpected losses comes the surprise that the conventional wisdom was wrong. Investors’ faith is tested, and some are found wanting. They sell first, then ask questions later.
We are currently in stage two, maybe testing stage three. Along with the 1987 bust, the current stock market crash - it fully deserves that name, with the Dow down 34% from its peak at one stage but recovering some of the loss since - was the fastest stock-market descent since The Great Depression. It is difficult to apply rational analysis when so much happens, so quickly.
View from the bottom
Stage three is stabilisation. Stocks halt their decline, thereby ending the impression that they will do nothing but fall. The panic subsides but the situation remains grim. Investors believed during the first stage that stock prices slide on a whim. Now they realise that equities stumble for good reason, and that until that reason is eliminated, they will continue to struggle, despite some good days. Shareholders’ losses will not soon be recouped.
This period is marked by turbulence. Stocks rally, sometimes furiously, only to be knocked back down. Investor sentiment varies between guarded optimism that the end is at least remotely in sight, and despair that the hope was false. This is typically the bear market’s longest period, extending for several months. (Several years for The Great Depression, but we do not wish to emulate that example.)
Stage four is anticipation. This is when stocks start their recovery. As with the bear market’s beginning, almost nobody recognises its end until after the fact. The news at the time tends to be almost unrelievedly grim, accompanied by articles about how stocks’ golden days have passed. However, some investors perceive economic improvement distantly in the future. They make their bids, and stocks begin to rise.
A classic case occurred in March 2009. The recession was in its terrifying midst. Real US gross domestic product declined that quarter, and the next quarter, and the quarter after that. The Morningstar Ibbotson Conference was held that month to empty seats, with the keynote speaker predicting several more months of equity losses. The rally began the next day.
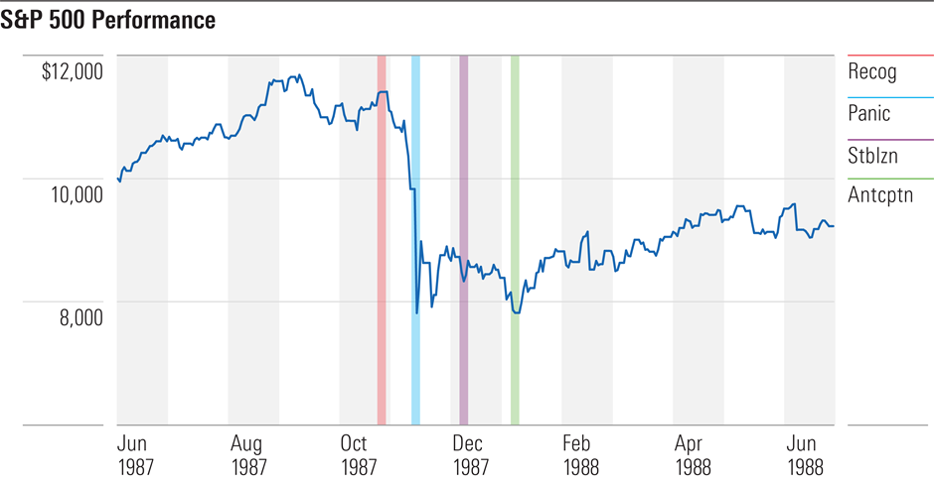
Example #1: Black Monday
This is how the four stages played out 33 years ago in US markets:
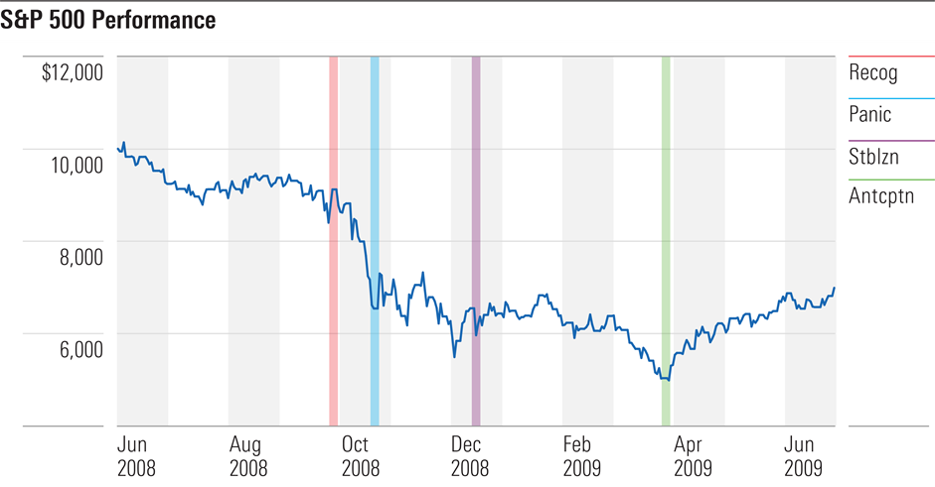
Example #2: Financial crisis
And this is how they operated more recently, from late 2008 through early 2009:
Looking forward
This scheme applies to bear markets that are primarily caused by recession fears. In addition to the two historic bears charted above, the scheme can be used to map the much smaller slump of 1990, and 1981’s decline, and 1970’s sell-off. Of course, the details for each of those markets vary, sometimes substantially but the pattern is roughly similar.
However, the blueprint does not work for bear markets that arise from other causes. For example, the stock market’s grinding decline from 1973 through 1974 doesn’t map well to the four stages, because it was caused by steadily increasing inflation fears. The 2000-02 technology-stock implosion also fails the test, because the major concern as the New Era concluded was that equity prices had risen too high, not - aside from some of the internet stocks - that earnings would disappear.
The question then becomes, does the current bear market fall into the first category or the second?
The former would be greatly preferable. With that scenario, the enormous uncertainty about the spread of the coronavirus, and the economic damage that the containment efforts will wreak, disappears over the next few months. The problems will remain large, but they will at least be known quantities, and the financial markets are adept at planning for what is known.
Should the picture become clearer, the four-stage scheme figures to be relevant. Fairly soon, I should think, stocks will more firmly enter the third stage, that of stabilisation. That doesn’t mean that they won’t decline further, but the struggle will at least be bounded. Within months, not years, the stock market recovery should begin.
On the other hand, should uncertainties remain high and unresolved, perhaps because the virus’s behaviour confounds the scientists, or because the financial stimulus efforts prove ineffective, then all bets are off. I do not know how to analyse such a situation. I hope that I never shall.
Big hat, no cattle
I have written about buying market puts, giving the right to sell at an index level, as protection on institutional portfolios. But you know what? It was easy for me to talk bravely as a columnist, with no public numbers on the line. It would have been much more difficult to follow through and make the trade as a professional manager, knowing that if stocks didn’t quickly tumble that I would have squandered previous performance in protecting against an emergency that did not arrive. I might not in fact have made that trade, and either way, it doesn’t count if you don’t do it.
John Rekenthaler is Vice President of Research for Morningstar, a columnist for Morningstar.com and a member of Morningstar's Investment Research Department. This article is general information and does not consider the circumstances of any investor.
Try Morningstar Premium for free