Thanks to almost 5,000 readers who took on the Factfulness quiz. While the majority scored less than 5 out of 13, this was not unexpected and heightens the purpose of the exercise: to give people a more accurate view of global development.
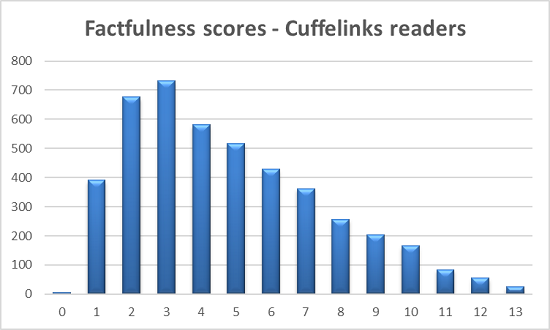
The following charts show how Cuffelinks readers' results compare to the random guesses of a chimpanzee (yellow dotted lines), the Australian average (black outline), and a selection of other countries, question by question.
Cuffelinks readers' averaged better than a chimpanzee for 6 of the 13 questions, and better than the Australian average for 10 questions. The question that ranked highest for difficulty was how many girls in low income countries finish primary school (only 16% answered correctly) and the easiest question was on climate change (95% correct). This also corresponds to Gapminder's overall averages. A short explanation, extracted from Gapminder's website, is included for each question.
Question 1
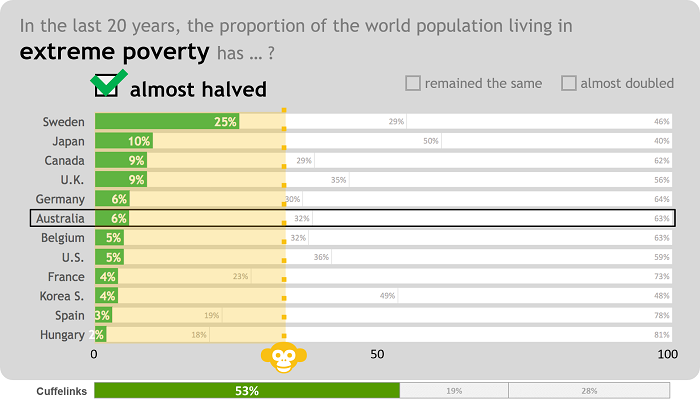
The share of people living on less than US$1.90/day fell from 34% in 1993 to 11% in 2013, according to World Bank. However, extreme poverty is difficult to measure. The poorest people are subsistence farmers with insufficient harvests or destitute slum dwellers, with unpredictable and constantly-changing living conditions and few documented monetary transactions. But even if the exact levels are uncertain, the trend direction is not, because the method for estimating has not changed. We can trust that the level has fallen to at least half, if not one-third.
Question 2
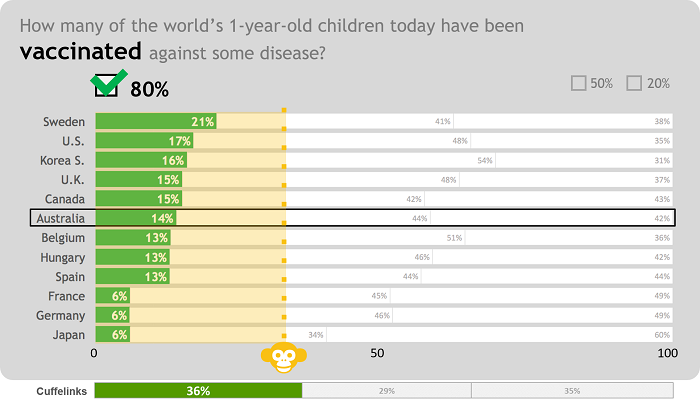
88% of 1-year-old children in the world today are vaccinated against some disease, according to the World Health Organisation (WHO). Gapminder rounded it down to 80% to avoid overstating progress. The common vaccines are as follows:
- BCG (Tuberculosis): 88%
- DTP3 (Diphtheria tetanus toxoid and pertussis): 86%
- MCV1 (Measles, 1st dose): 85%
- Pol3 (Polio): 85%
- HepB3 (Hepatitis B): 84%
- PAB (Neonatal tetanus): 84%
- Hib3 (Haemophilus influenzae type b): 70%
- MCV2 (Measles, 2nd dose): 64%
- PCV3 (Pneumococcal conjugate): 42%
- RotaC (Rotavirus): 15%
Question 3
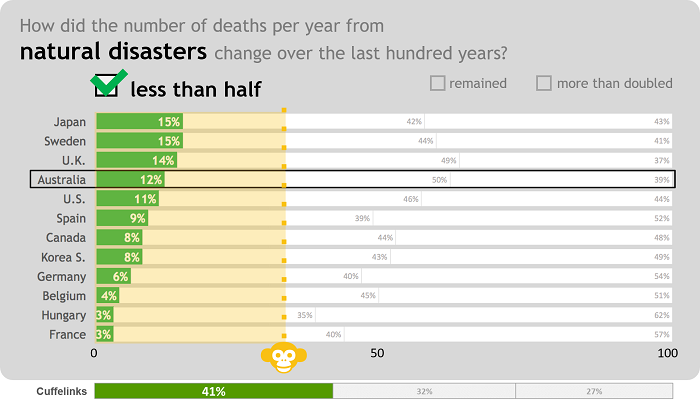
Annual deaths from natural disasters have decreased by 75% over the past 100 years, according to the Emergency Events Database (EM-DAT). Since disasters vary from year to year, 10-year averages are compared. In the 10 years from 2007 to 2016, on average 80,386 people were killed by natural disasters per year. This is 25% of the number 100 years earlier (1907–1916), when it was 325,742 deaths per year.
The huge decline in disaster deaths would be even more striking if two other major global changes were also taken into account. First, the number of people has increased by four, which calls for counting disaster deaths per capita. From 1907–1916, there were 181 disaster deaths per million people, and from 2007–2016, the number was 11. The relative number has dropped to 6% of what it was 100 years ago. Second, 100 years ago the communication technologies for reporting disasters were primitive, compared to the monitoring of today, which means that many catastrophes must have gone unrecorded or been under-reported.
All known emergency events have been categorised as follows: animal accident, complex disasters, drought, earthquake, epidemic, extreme temperature, flood, fog, impact, insect infestation, landslide, mass movement (dry), storm, volcanic activity, and wildfire.
Question 4
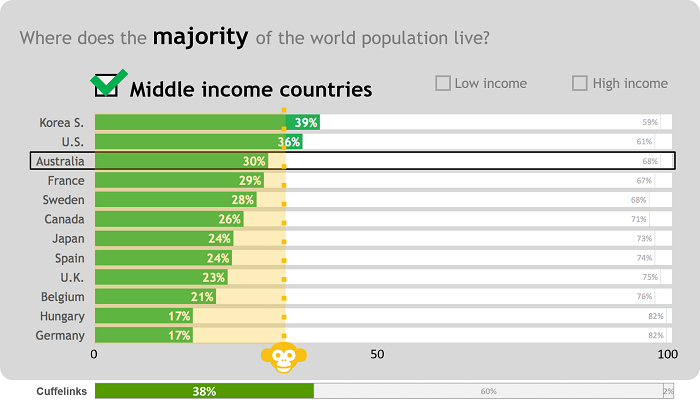
The majority of people live in middle-income countries. The World Bank divides countries into income groups based on gross national income per capita in current US$. The low-income countries represent 9% of the world population, the middle-income countries 76%, and the high-income countries, 16%.
Question 5
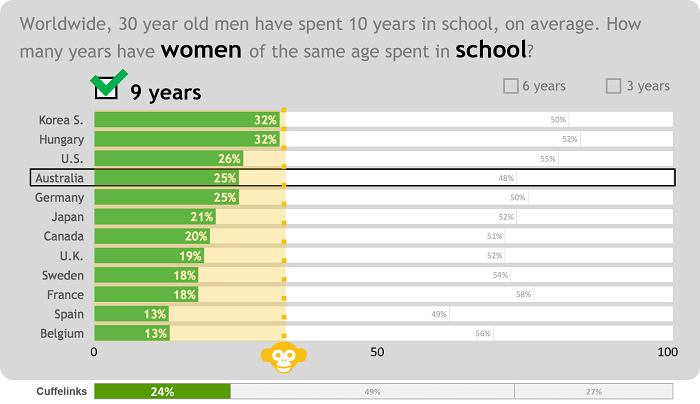
Worldwide, women aged 25 to 34 have an average of 9.1 years of schooling and men have 10.2, according to the Institute for Health Metrics and Evaluation (IHME) estimates from 188 countries.
Question 6
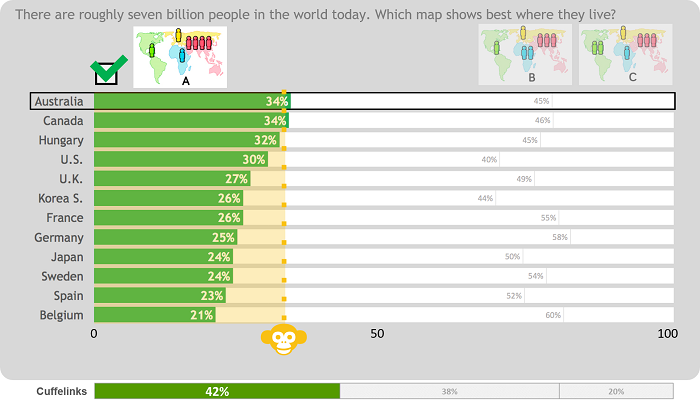
The world population in 2017 was 7.6 billion, according to the United Nations Population Division (UN-Pop). That would usually be rounded to 8 billion, but Gapminder shows 7 billion because they are rounding the population region by region. The populations of the four Gapminder regions were estimated based on national data from UN-Pop: the Americas, 1.0 billion; Europe, 0.84 billion; Africa, 1.3 billion; Asia, 4.4 billion.
Question 7
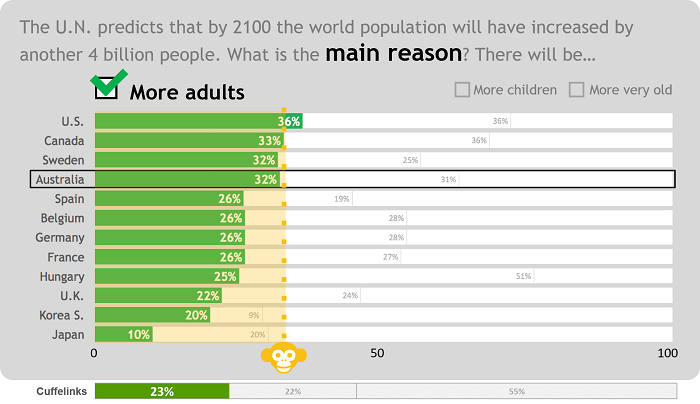
In their forecasts, UN-Pop demographers calculate that 1% of population increase will come from 0.37 billion more children (age 0 to 14), 69% from 2.5 billion more adults (age 15 to 74), and 30% from 1.1 billion more old people (age 75 and older).
Question 8
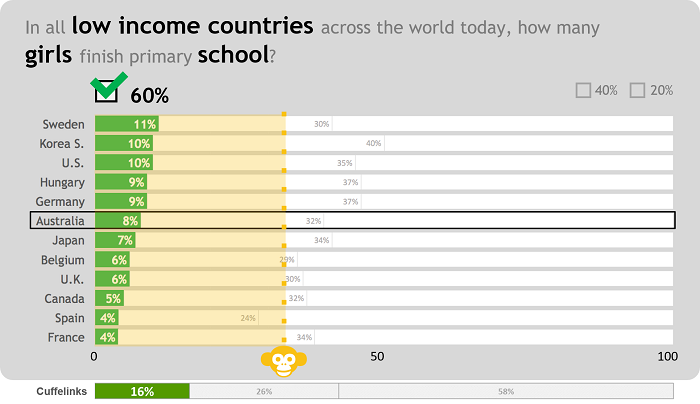
According to World Bank, 63% of the girls in low-income countries finished primary school in 2015. Primary completion rate is the number of new entrants (enrollments minus repeaters) in the last grade of primary education. World Bank defined 31 countries as low-income countries in 2017.
Question 9
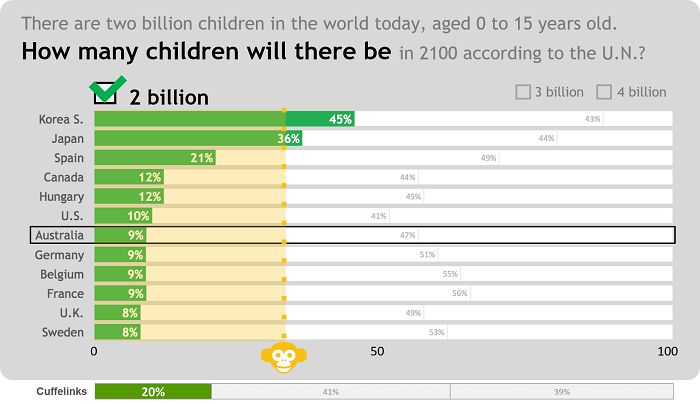
UN-Pop demographers publish a 'medium fertility variant', which falls between the highest and lowest predictions of fertility and mortality decline worldwide. UN-Pop predicts that the number of children in the year 2100 will not be higher than it is today.
Question 10
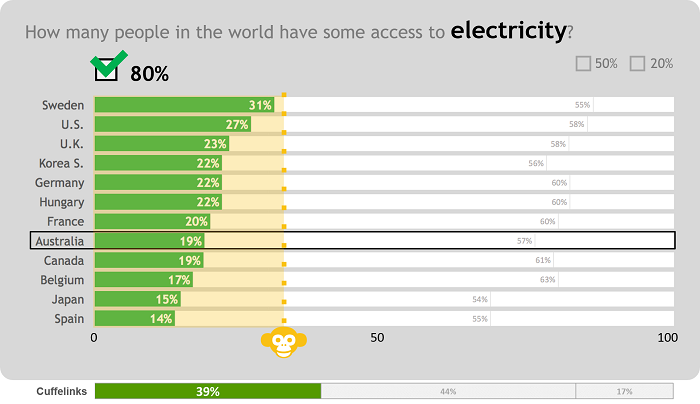
A majority of the world population, 85%, had some access to the electricity grid in their countries, according to Global Tracking Framework (GTF, a collaboration between the World Bank and the International Energy Agency). Gapminder has rounded this down to 80% to avoid overstating progress. The term 'access' is defined differently in all their underlying sources, and households may experience significant power outages and still be listed as 'having access to electricity.'
Question 11
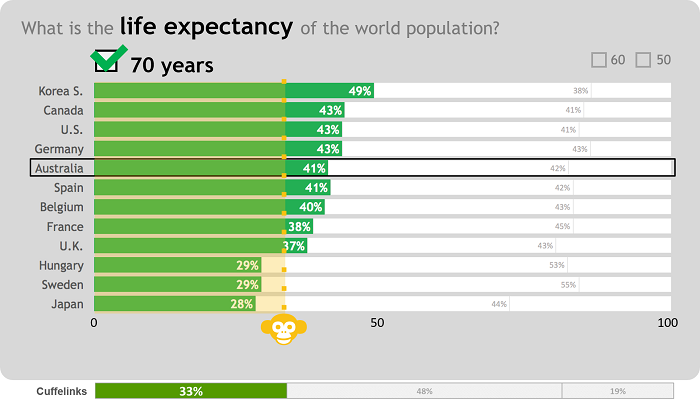
The average global life expectancy for those born in 2016 was 72.5 years, according to IHME. The three answer alternatives were chosen by Gapminder after first having asked the question with an open answer field, letting respondents write any age they wanted. Most people wrote 50 or 60 years.
Question 12
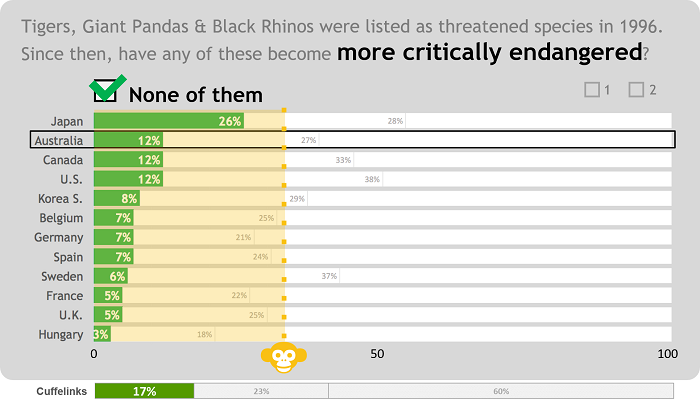
None of the three species are classified as more critically endangered today than they were in 1996. The data is based on the IUCN Red List of Threatened Species.
Question 13
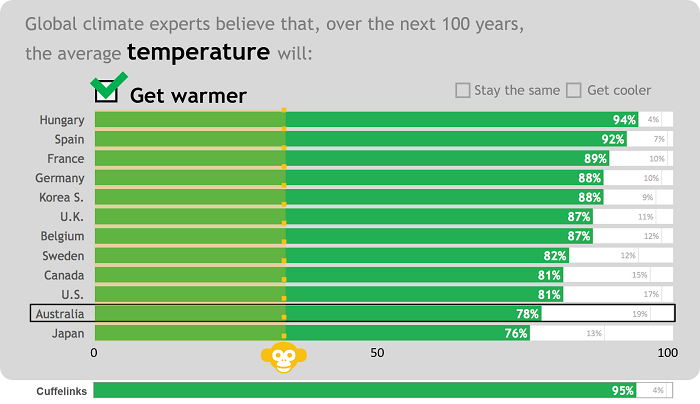
The term 'climate experts' refers to the 274 authors of the IPCC's Fifth Assessment Report (AR5), published in 2014 by the Intergovernmental Panel on Climate Change. Here is what they predict about the changes in the climate system:
Surface temperature is projected to rise over the 21st century under all assessed emission scenarios. It is very likely that heat waves will occur more often and last longer, and that extreme precipitation events will become more intense and frequent in many regions. The ocean will continue to warm and acidify, and global mean sea level to rise.
Leisa Bell is Assistant Editor at Cuffelinks. For a summary of Cuffelinks' Factfulness Quiz results, click here.
Free fact-questions and related information and data from www.gapminder.org.