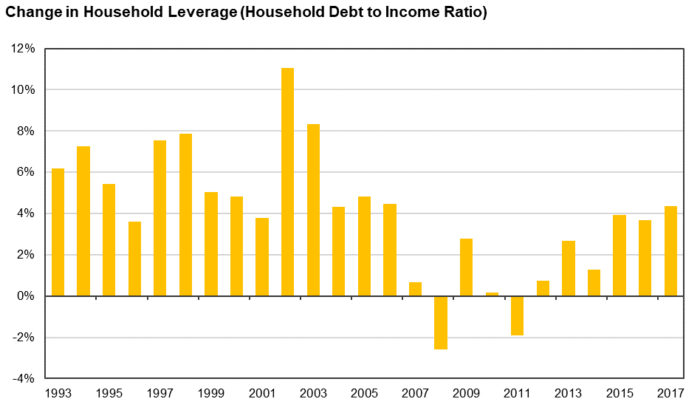
Australians appear to be addicted to leverage, and most specifically, housing leverage. In 23 of the last 25 years, Australian household leverage has increased. That is, the average household has borrowed more money for the same dollar of income. The debt to income ratio has continued to rise, with only occasional pauses. Will this continue into perpetuity? We are reminded of a famous German proverb, “Trees don’t grow to the sky.”
Source: Reserve Bank of Australia, Auscap
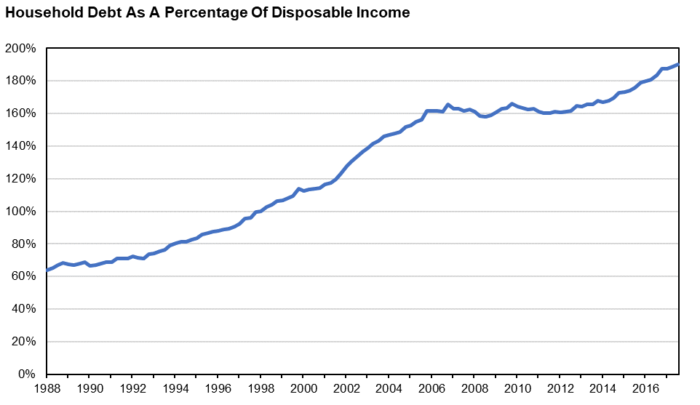
Household debt as a percentage of disposable income now exceeds 190%.
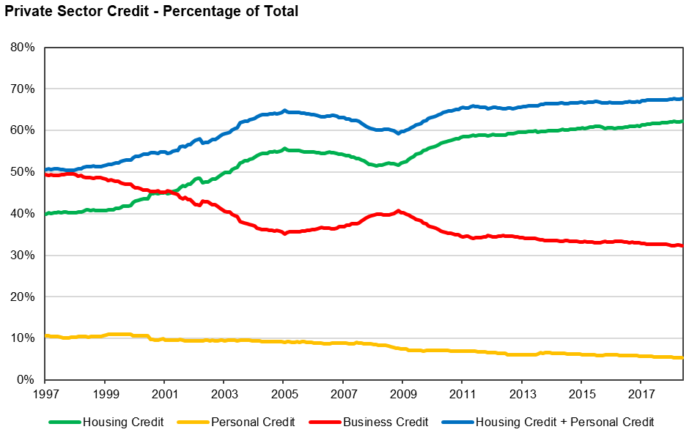
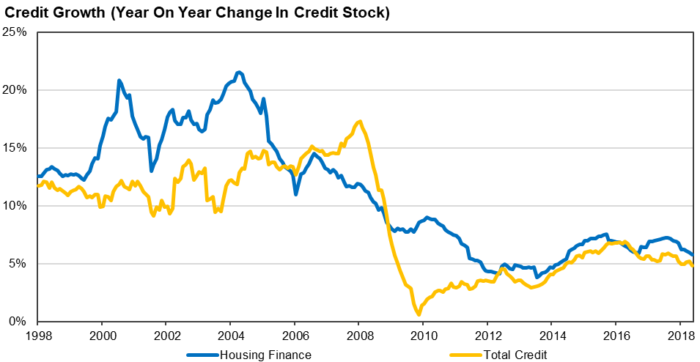
Housing credit is now over 62% of total private sector credit.
Source: Reserve Bank of Australia, Auscap
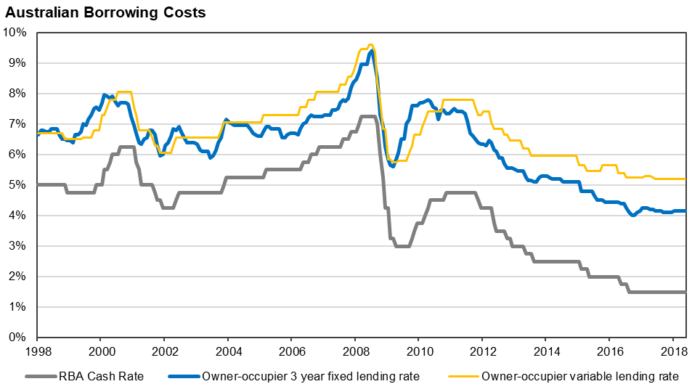
Part of the equation has been falling borrowing costs. As interest rates fall, households can afford to borrow more money with the same dollar of income. Whether this is a sensible strategy is a question for debate. In recent years, APRA has started to insist that lenders use a minimum borrower interest rate assumption of 7% to assess a borrower’s capacity. This is recognising that interest rates are unlikely to stay low forever, and that housing loans are typically written over a 25 or 30 year period. Ensuring that households can afford their loans under a higher interest rate scenario is logical and sensible.
Will greater recognition of expenses be the straw that breaks the camel's back?
The Financial Services Royal Commission appears to have uncovered another reason explaining why and how leverage has been ballooning. The availability of credit has been growing partly due to the widespread understating of household expenses and a corresponding lack of due diligence by lenders to investigate the facts. The Household Expenditure Measure (HEM), an index designed to put a floor on claims of low living expenses, was relied on by many loan applicants and lenders as the estimate for actual annual non-housing related living expenses. When applied, this index has been an unrealistically low approximation for the majority of households.
We suspect ensuring appropriate household expenditure due diligence by lenders will be an outcome of the Royal Commission. As Wayne Byers, Chairman of APRA, stated in a speech to the Australian Business Economists,
“Under ASIC’s responsible lending obligations, banks are required to make reasonable inquiries into borrowers’ living expenses, and APRA’s own prudential practice guide is clear that benchmarks shouldn’t be relied on to proxy expenses. Benchmarks can be helpful in providing a prudent floor where borrower declared expenses appear low, but should not be a replacement for making reasonable inquiries.”
The major banks appear to have already adopted more stringent measures. Formal due diligence on bank account and credit card statements could be an outcome. Positive comprehensive credit reporting will undoubtedly give lenders a greater ability to assess a borrower’s financial position.
How this affects leverage ratios and the creation of household credit is unclear. Household leverage ratios may be peaking. This is significant, because increasing leverage has clearly been a partial driver of house price growth over recent years. Credit contraction would reduce property price growth. The outcome of the Royal Commission, APRA’s multi-year focus on ensuring prudent lending standards and the banks’ adoption of more rigid standards is not yet clear in the data. As Wayne Byers commented “the changes in lending practices to date do not seem to have had an obvious impact on housing credit flows in aggregate”. But perhaps this is no surprise. Living expenses featured in the Royal Commission in March 2018. Our enquiries with a number of lenders suggest that living expenses came into greater focus around this time. So, will a sustained focus on living expenses be the straw that breaks the camel’s back?
Mixed reporting of credit growth
The size of domestic credit in aggregate relates to the stock of total credit in an economy. It is last year’s aggregate credit plus new credit created less any credit extinguished.
Source: Reserve Bank of Australia, Auscap
It is our view that this is a lagging indicator for what is happening in the economy, which operates more on the flow of credit. That is, how much new credit is being created this year versus how much was created last year. The largest component of credit is housing-related credit.
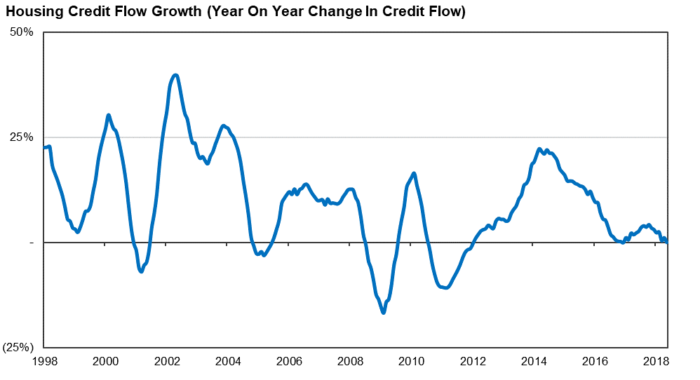
Source: Reserve Bank of Australia, Auscap
The most recent May 2018 data point suggests new housing credit growth is weak, coming in at just +0.08% on an annualised basis. The actual exchange of properties that has led to this data most likely occurred six to eight weeks prior. This data potentially predates any changes made by lenders following the focus on household expense verification.
We suspect there are other leading indicators, such as auction clearance rates. It would be understandable that vendors have price expectations based on comparable sales made six to twelve months ago. But if a borrower’s capacity has been reduced, there might be a noticeable gap between a buyer’s ability to pay and a vendor’s expectation on price. Clearance rates around the country have recently fallen significantly.
Weekly Australian Auction Clearance Rate, Combined Capital Cities
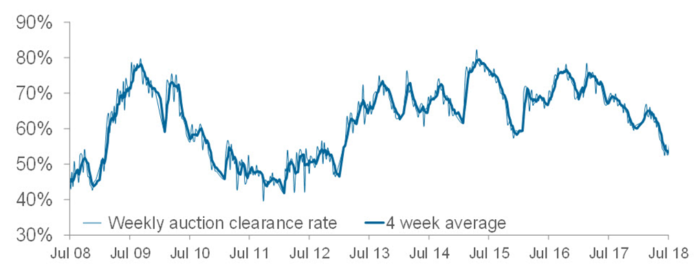
Source: Corelogic
If lower clearance rates and listing volumes are symptomatic of falling housing credit growth, this should become apparent in the data over the coming months. The level of housing credit growth has important implications for the domestic economy. Has Australia become overly reliant on the creation of housing credit and increased household leverage to fuel economic growth? Only time will tell, but it might provide both long and short opportunities in the near term.
Tim Carleton is Principal and Portfolio Manager at Auscap Asset Management, a boutique Australian equities-focussed long/short investment manager. This article contains information that is general in nature. It does not take into account the objectives, financial situation or needs of any particular person.