The latest SPIVA (Standard & Poor’s Indices versus Active) results are in. They provide important lessons on where to look if you’d like to find long-term outperforming managed funds.
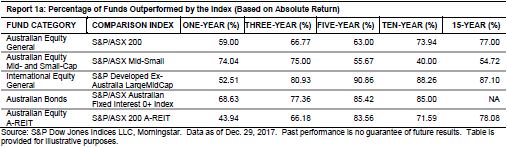
In their latest scorecard, S&P evaluated returns of 786 Australian equity funds (large, mid, and small cap, as well as A-REIT), 378 international equity funds, and 109 Australian bond funds. For the first time in Australia, S&P was able to provide data for a 15-year period. The results are summarised below:
Click to enlarge
The SPIVA study has consistently observed that the majority of Australian-managed funds fail to beat comparable benchmarks over the long-term. For example, over the 15-year period ending December 2017, more than 87% of international equity funds underperformed their benchmark after fees. In all categories, over almost all periods, a large percentage of managed funds failed to beat their benchmark.
But there are some important lessons to be gleaned. Here are the main six:
Funds that invest in smaller companies do better
The best performing group of funds by far over five, 10, and 15 years were those that invested in Australian smaller companies. More than 60% outperformed over 10 years and around 45% over 5 and 15 years. That’s much better than all other categories, where success rates are generally less than 25%.
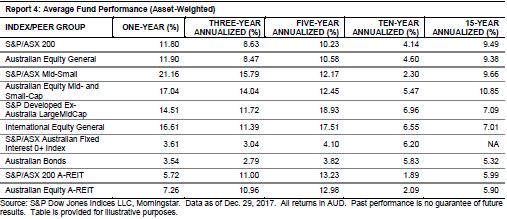
It’s often pointed out (mostly by managers of funds that invest in large companies) that the Australian small caps index is poorly constructed and easy to beat, which makes it a low hurdle. There is some truth in that, but it’s also true that smaller company funds delivered a greater total return compared to larger company funds, as can be seen below:
Click to enlarge
Over all time horizons, mid-small company funds beat their larger company peers.
So, Lesson 1: It’s a good idea to have some small-mid cap exposure in your investment portfolios.
Overall returns aren’t as great as most people think
The Report 4 table above also shows that the best 15-year returns came from small-mid companies at around 10% p.a. Large companies would have delivered 9-10% p.a. on average, depending on whether you had an active manager or an index fund. The returns exclude franking credits, so that’s pretty good.
In comparison, international shares fared worse at around 7% annual returns. This is the case even though global shares have performed much better over the past five years. We maintain a low allocation to global shares, because compared to Australian shares, they’re significantly more overvalued.
Over 15 years, Australian bonds have delivered just over 5%, and A-REITs (or listed property trusts) around 6% p.a.
Thus, on average, a balanced portfolio of 60% shares/property, 40% bonds/cash might have delivered investors around 7.5% p.a. This compares well to the average balanced super fund, which according to Chant West has delivered around 6.8% p.a. over the past 15 years, after tax.
So Lesson 2: Recognise that average returns aren’t that great, and make sure your return target is realistic.
However, many investors do far worse than this. That’s because they tend to invest near market highs and sell near lows. Many credible studies show the impact of poor timing is that the average investor will achieve returns 2-3% p.a. worse than the average, mostly because of poor timing decisions.
Lesson 3: Unless you’re accomplished at going against the crowd, buy-and hold strategies that deliver consistent returns should be preferred.
Growth versus value
Although the Australian study doesn’t look at differences in returns from investment styles, the much bigger US study does. The US study showed that over 15 years, the difference between value and growth styles was not significant, albeit it was over short periods, e.g. over the past year, US large cap growth funds delivered almost 30% returns, compared to value funds at 15%. Other times the reverse has occurred, although rarely to the same degree.
Interestingly, over 15 years, large cap growth outperformed large value slightly. And small cap value outperformed small cap growth slightly.
Lesson 4: Allocations to both growth and value styles are likely to outperform at different times. You might get the same long-term result, but perhaps a smoother overall rise if you have both in your portfolio.
The stars from last time are more likely to be laggards next time
One of the biggest mistakes we see is the herd piling into last year’s best performing funds. That’s usually a big mistake. Our experience is that an equity fund delivering above 12% p.a. over ten years or more is extremely rare. So, if you invest in one that just did 20% p.a. for the last two years, chances are that a big part of that performance was due to the assets or market they have invested in is currently overvalued. Or their investment style has had a good run. Or they had a low amount of funds to manage but now they have a lot. Or all three.
Any of these things don’t bode well for the next few years’ returns from that fund.
So, Lesson 5: Be wary of funds that have delivered high returns in recent years.
The best funds might not be in the survey
The SPIVA survey is limited. It includes over 1,300 funds, but the data set is limited to funds included in Morningstar’s database and in the categories stated. Many of the best funds, including a sizeable number available only to wholesale investors, are not in the Morningstar database, or pursue an investment strategy not covered in the SPIVA survey.
As an example, about two-thirds of the funds in our Affluence Investment Fund portfolio are not on Morningstar or in categories not covered by the SPIVA study. Almost all of them have outperformed their benchmarks over time.
So finally, and most importantly, Lesson 6. Despite what the SPIVA study suggests, great funds and managers who can outperform over the long term are out there.
The full SPIVA report can be found here.
Daryl Wilson is CEO and Portfolio Manager of Affluence Funds Management Limited. This article is for general information only and not an investment recommendation. It should not be construed as tax, legal, or investment advice.