Historical returns can be a good guide when evaluating the merits of a Listed Investment Company (LIC). However, investment performance represents only one side of the risk-reward equation. Investors also need to factor in the risk metrics when assessing a LIC, such as the following three:
- Beta
- Standard deviation
- Sharpe Ratio
Beta
Beta measures the magnitude of a LIC’s movement relative to its benchmark. A beta measurement of 1 conveys that the LIC is moving in line with its benchmark. A beta of less than 1 indicates it is less volatile than its benchmark, and a beta of more than 1 suggests that the LIC is more volatile than the benchmark.
For example, if a LIC has a beta of 1.1 in relation to the S&P/ASX All Ordinaries, then the LIC historically has been 10% more volatile than the index. Therefore, if the S&P/ASX All Ordinaries has gained 10%, with everything else being equal, the LIC would be expected to have gained 11% (10% x 1.1). The reverse is true if the index has fallen.
In the graph below, we calculate some LIC’s five-year share price beta. Overall, the graph suggests that the share price movement of the LIC is lower than the market. This also suggests that the inherent active nature of a LIC would be a good addition to an investment portfolio to smooth out long-term volatility.
Five Year Share Price Beta
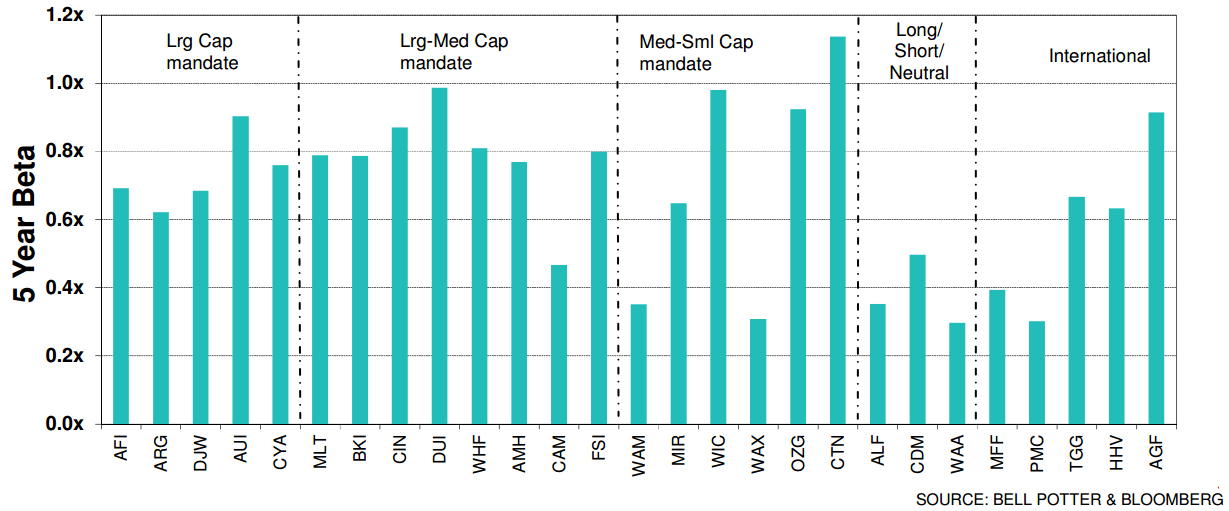
Other observations from the graph:
- LICs within the Large Capitalisation and the Large to Medium Capitalisation mandate have a beta largely between 0.6x-0.9x compared with the market. This suggests that, with the right LIC, an investor could achieve the same performance as the market with less risk.
- All the Wilson Asset Management LICs (ASX: WAM, WAX and WAA) have a beta of less than 0.5x due to their historically high portfolio weighting in cash.
- Australian Leaders Fund (ASX: ALF) and Cadence Capital (ASX:CDM) have low betas due to their ability to short investments in comparison to their benchmark.
Standard deviation
Standard deviation is a statistical measurement of historical volatility and is the most common definition of risk. It measures a LIC’s dispersion of investment return from its historical average. A larger standard deviation indicates higher volatility.
We use the pre-tax net tangible assets (NTA) as our data point to assess the standard deviation. The pre-tax NTA represents a better measure of a LIC’s investment performance.
The graph below reflects the pre-tax NTA performance of LICs over the past five years. This is reflected by its position along the horizontal, with LICs further to the right achieving higher returns. The graph also highlights the standard deviation of the LIC’s pre-tax NTA performance. This is reflected by each LIC’s positon along the vertical axis, with more volatile LICs positioned higher on the graph.
Pre-Tax NTA Performance Standard Deviation vs Pre-Tax NTA Performance
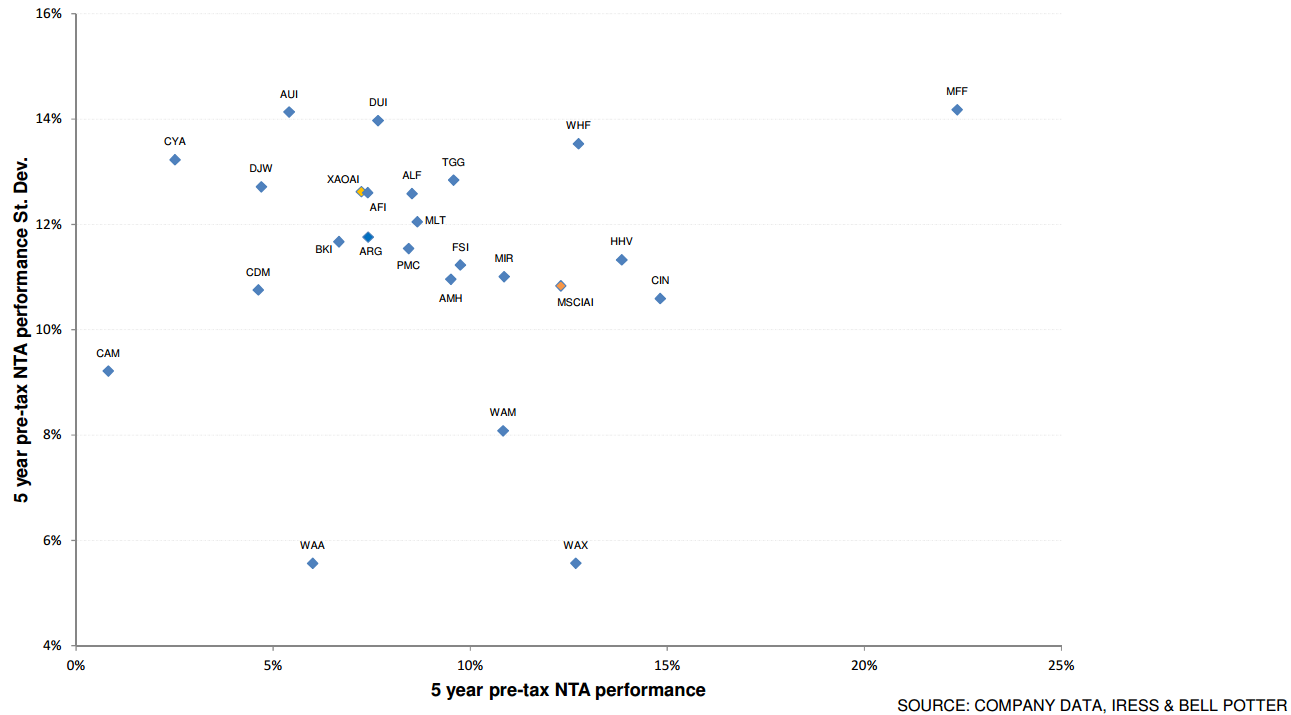
Other observations from the graph:
- Century Australia Investments (ASX:CYA) and Australian United Investment (ASX:AUI) have domestic investment mandates but slightly higher risk profiles than the S&P/ASX All Ordinaries Accumulation Index.
- Diversified United Investments (ASX: DUI) also has a higher risk profile due to its holding international exchange traded funds (ETFs) in its underlying portfolio.
- The majority of LICs have a lower standard deviation than the S&P/ASX All Ordinaries Accumulation Index, of 12.6%, and nearly half of these LICs outperformed this index.
- Wilson Asset Management LICs (ASX: WAM, WAX & WAA) attributes its low standard deviation to holding a significant amount of cash.
- Magellan Flagship Fund (ASX: MFF) has been the best performing International LIC on a risk-adjusted perspective.
Sharpe Ratio
The Sharpe Ratio reflects the ratio of all excess returns over the risk-free rate divided by the standard deviation. The higher the Sharpe Ratio, the better the LIC’s performance in proportion to the risk it’s taken. A LIC with a negative Sharpe Ratio would suggest that a risk-free asset (example, government bond) would be a better investment.
The graph below shows the Sharpe Ratio of some LIC’s investment performance over the past five years.
Five Year Pre-Tax NTA Sharpe Ratio
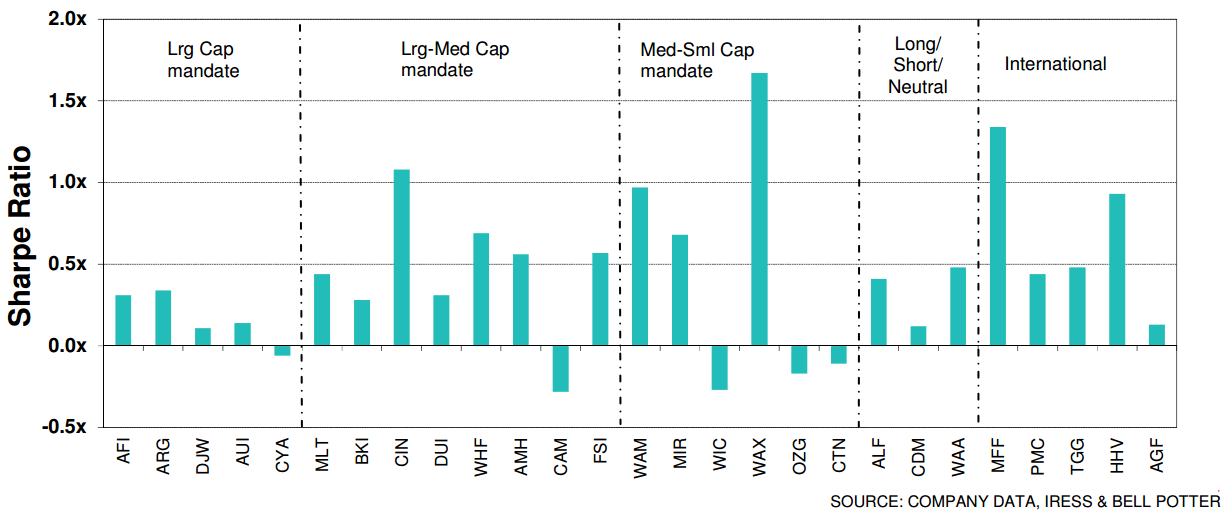
Key notes from the graph above are:
- Large market cap LICs and large-to-medium cap LICs have an average Sharpe Ratio of 0.36x, which is also the ratio for the S&P/ASX All Ordinaries Accumulation Index.
- International-focussed LICs have outperformed risk-free assets over the past five years.
Conclusion
The return is only one side of the investment equation. Investors also must be aware of the risk they are assuming to achieve those returns before they can make an informed judgement when comparing LICs.
These three metrics do not tell the complete story. However, they should be used together with historical return, and qualitative factors such as investment philosophy, management experience and the cost of running the LIC. Together, these factors will make investors far more informed when determining which LICs to add to their portfolios.
Nathan Umapathy is Research Analyst at Bell Potter Securities. This document has been prepared without consideration of any specific client’s investment objectives, financial situation or needs and there is no responsibility to inform you of any matter that subsequently may affect any of the information contained in this document.
For the latest Bell Potter Quarterly Report and Weekly NTA updates, click here.