Register For Our Mailing List

Register to receive our free weekly newsletter including editorials.

Home / 177

US shares at new highs, but where's Australia?

US share prices have been doing well this year. The broad market indexes have reached new all-time highs, finally topping their previous peaks at the top of the 1990s ‘dot com’ boom and the 2000s credit boom.

The chart below shows four of the main US market indexes over the past four decades.

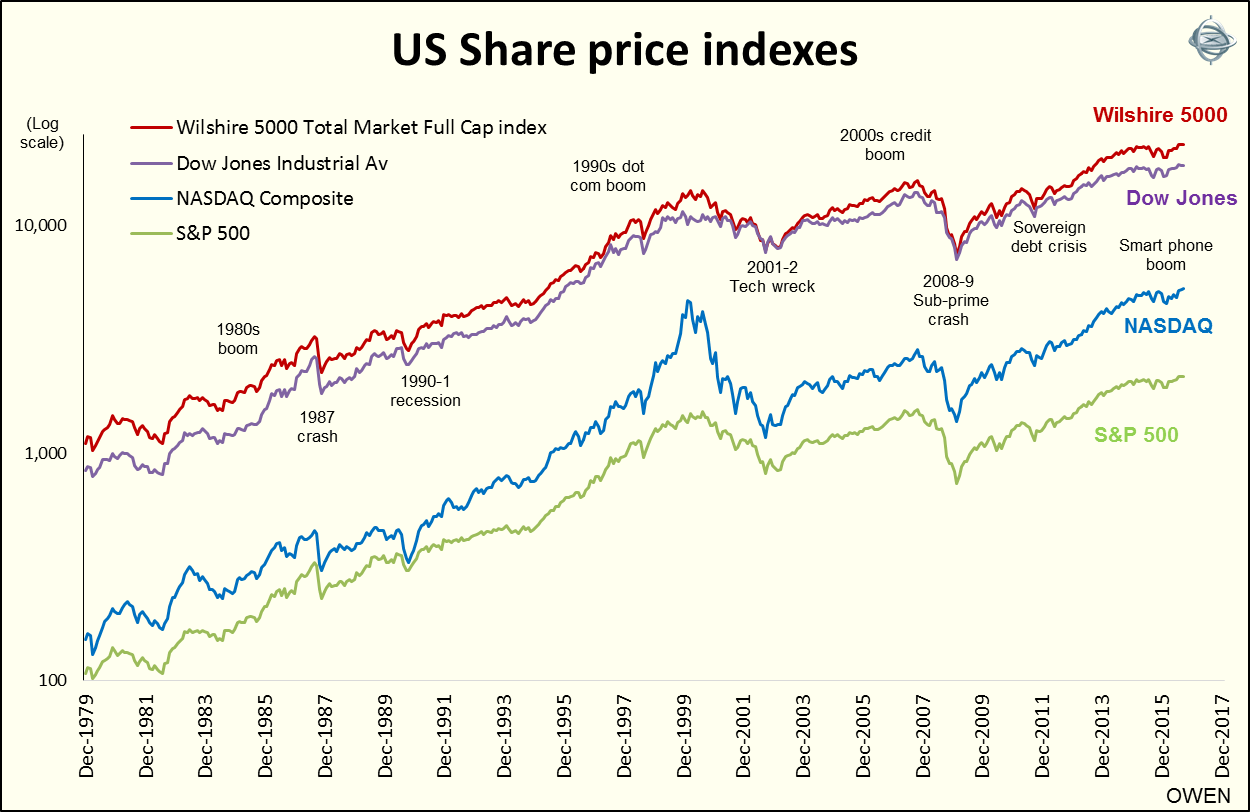
This shows that the current boom is not confined to just a few ‘hot stocks’, but enjoyed by the whole market. The Dow Jones Industrial Average measures the prices of just 30 of the largest stocks including Apple, Microsoft, IBM, McDonalds, Coca-Cola and Disney. The S&P 500 index covers 500 large and mid-sized companies, and the Wilshire 5000 index covers 5000 companies including thousands of small and micro stocks. The NASDAQ composite is heavily weighted toward technology companies.

The stock market boom in the US has been driven by two main factors: low interest rates and the global smart phone revolution. However, the US Federal Reserve turned off the ‘QE’ tap in 2014 and started raising interest rates in December 2015. The US government has also been tightening fiscal policy in recent years with progressively lower budget deficits. So the boom is overcoming the twin headwinds of tightening monetary and fiscal policies.

The main driving force has been the global technology revolution. The smart phone is changing how billions of people in virtually every country on the planet go about their daily lives. New technology is also revolutionising how businesses operate, from cloud computing to inventory management to accounting.

All of this requires new hardware and software. Factory workers in low wage countries build the hardware out of rocks dug up from quarries like Australia. But the real money is in the know-how and software and those come mostly from American companies. The American economy may be struggling to get back to normal growth but American companies are leading the global technology revolution.

Australian versus US shares

US shares have beaten Australian shares handsomely over the past five years despite Australia enjoying stronger economic growth and population growth.

The US S&P500 Price Index is 40% above its 2007 high, and with dividends, it is 70% above. The Total Return series after US inflation is 48% above 2007 highs. But the Australian All Ords Price Index is still 18% below its 2007 highs. With dividends it is 20% above, but the Total Return series after local inflation is still 2% below the peak (these numbers are to end September 2016).

A better comparison is an Australian investor in Australian shares after Australian inflation versus the same Australian investor in US shares after Australian inflation (that is, an Australian investor can chose to invest in either Australian shares or US shares but suffers Australian inflation either way). Then US shares Total Returns less Australian inflation is +66% since 2007 high versus -2% for Australian shares. The difference is the currency effect of a falling AUD and higher inflation here than in the US. Investors tend to ignore inflation when comparing long-term performance.

Here is the longer term picture.

Both markets have returned average real total returns (including dividends and after CPI inflation) of 6.5% per year since 1900. While the real total returns have been the same, the components of returns have been different. Australian shares have delivered higher nominal price growth and higher dividend yields than US shares, but these benefits have been neutralised by Australia’s higher inflation rate, so the net real total returns after inflation have been the same in both markets.

The two markets have also followed different paths along the way. The next chart shows the accumulated real total returns from both markets – green for Australia and red for the US.

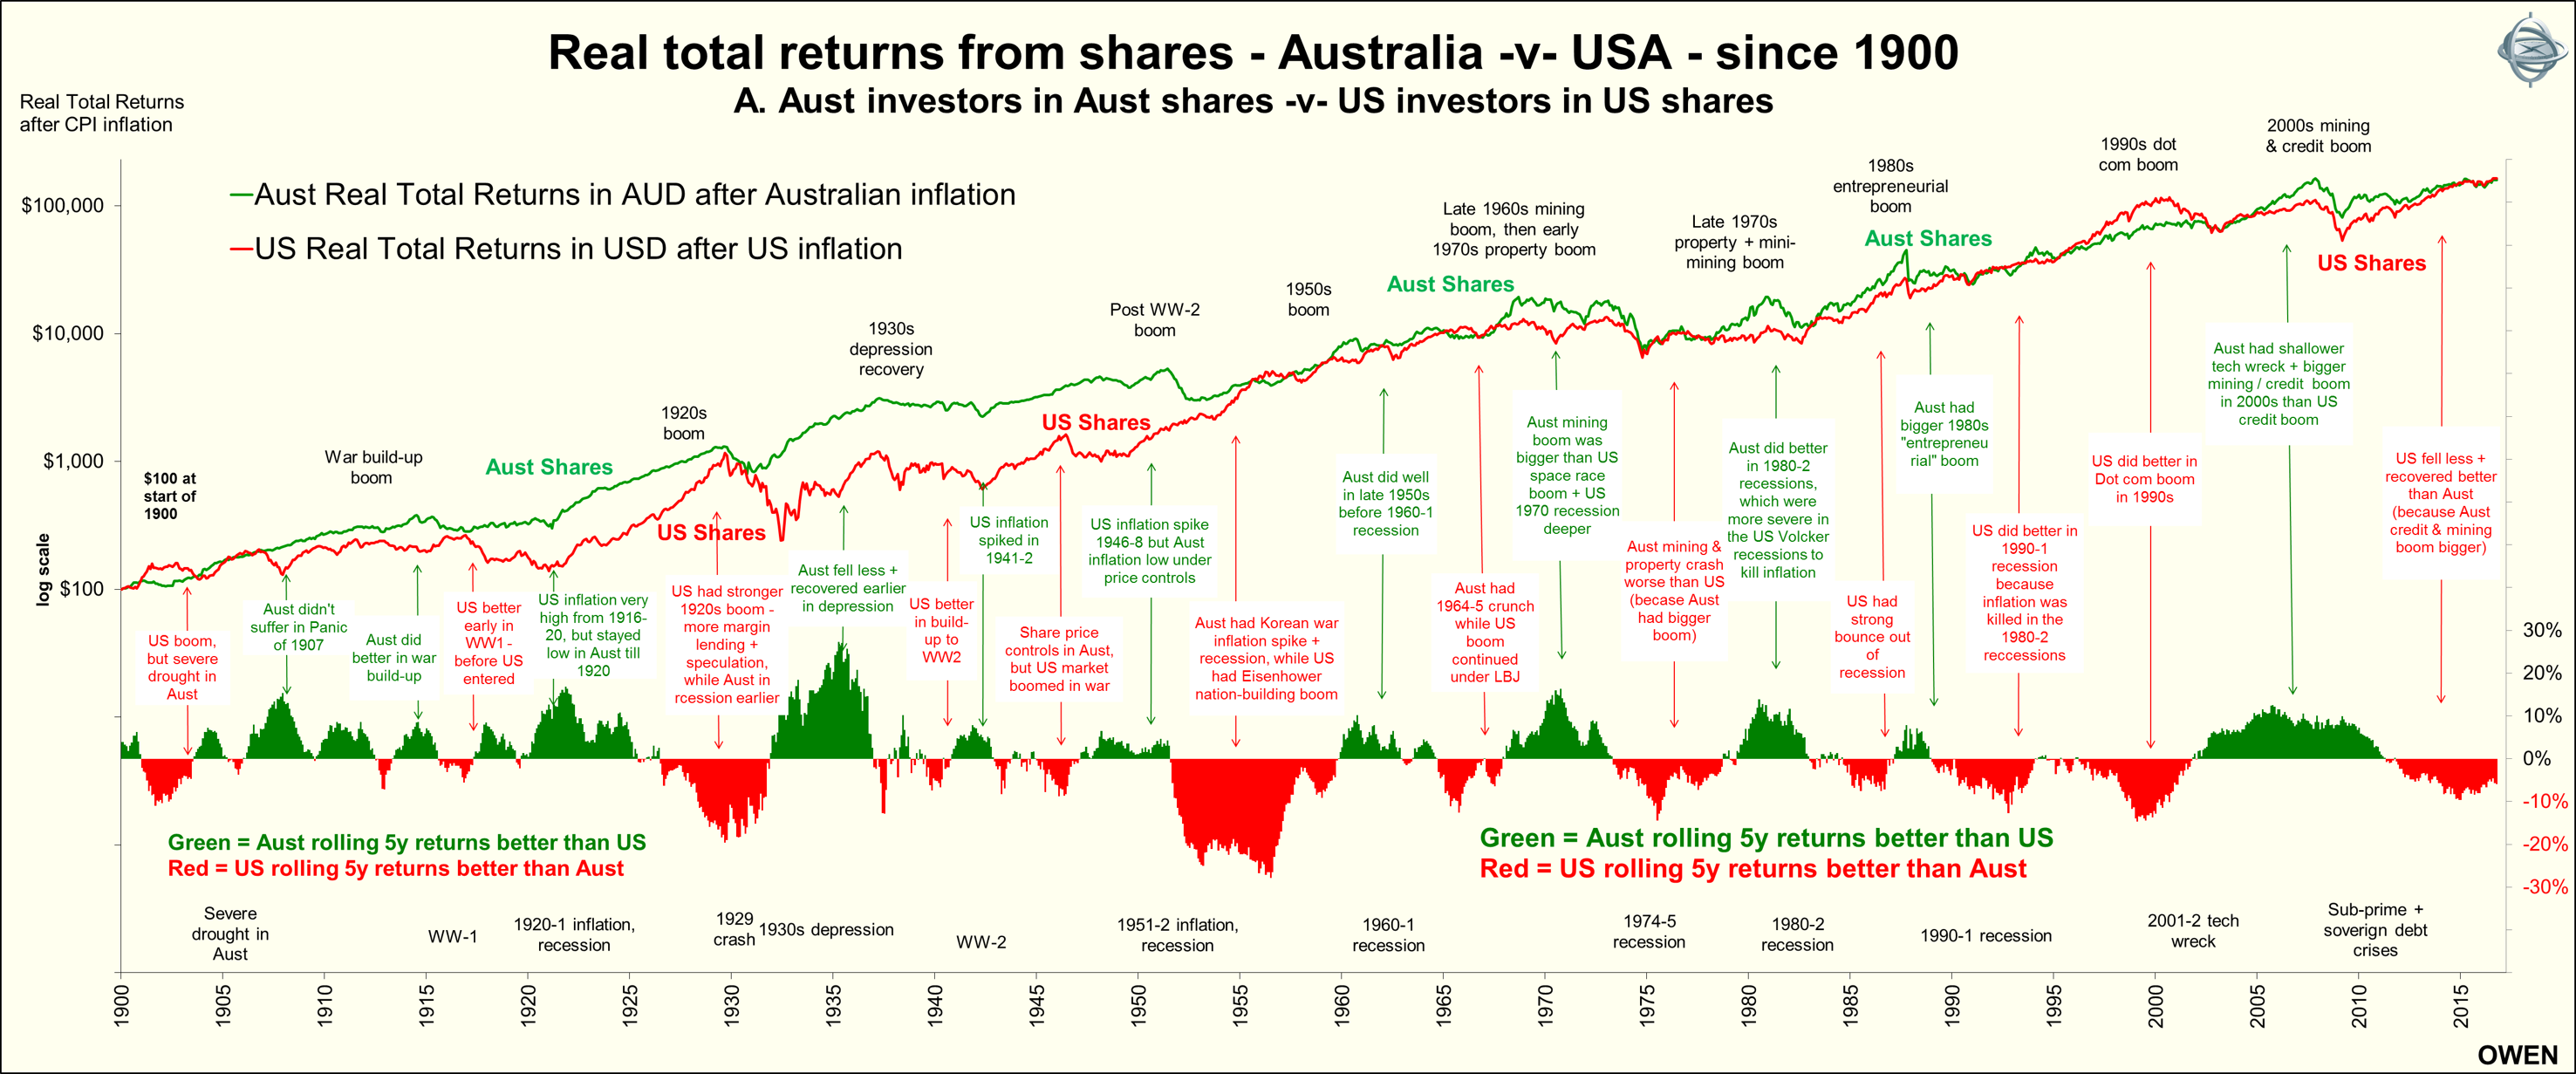
The lower section shows when Australia was winning (positive green bars) and when the US was winning (negative red bars). Both markets have risen in global booms and then fallen in the global busts, but Australia and the US have taken turns in having bigger booms and busts.

Starting from the right side of the chart we see that Australia had a bigger 2000s boom than the US, and so it suffered worse in the 2008 bust. On the other hand, the US had a much bigger ‘dot com’ boom in the late 1990s, so it had a more severe ‘tech wreck’ in 2001 and 2002. Australia had a much bigger mid 1980s ‘entrepreneurial’ boom (Bond, Skase, Herscue, Elliott, Connell and the rest), and so it had further to fall in the 1987 crash. And so it goes back through history.

The fact that the US market has been winning in recent years is more a reflection of our bigger 2000s boom and our bigger bust in the GFC. Australia and the US both had a credit boom in the 2000s but Australia also had a mining boom that crashed as well, and it is still recovering.

So it is America’s turn, and we are seeing it already with the US clearly leading the global technology boom.


Ashley Owen is Chief Investment Officer at independent advisory firm Stanford Brown and The Lunar Group. He is also a Director of Third Link Investment Managers, a fund that supports Australian charities. These past returns are not an indication of future returns.


RELATED ARTICLES

5 big calls for 2024

Australian shares outperform the US as commodities soar

Tech continues to run on rising prices not profits

banner

Most viewed in recent weeks

2024/25 super thresholds – key changes and implications

The ATO has released all the superannuation rates and thresholds that will apply from 1 July 2024. Here's what’s changing and what’s not, and some key considerations and opportunities in the lead up to 30 June and beyond.

Five months on from cancer diagnosis

Life has radically shifted with my brain cancer, and I don’t know if it will ever be the same again. After decades of writing and a dozen years with Firstlinks, I still want to contribute, but exactly how and when I do that is unclear.

Uncomfortable truths: The real cost of living in retirement

How useful are the retirement savings and spending targets put out by various groups such as ASFA? Not very, and it's reducing the ability of ordinary retirees to fully understand their retirement income options.

Is Australia ready for its population growth over the next decade?

Australia will have 3.7 million more people in a decade's time, though the growth won't be evenly distributed. Over 85s will see the fastest growth, while the number of younger people will barely rise. 

Welcome to Firstlinks Edition 552 with weekend update

Being rich is having a high-paying job and accumulating fancy houses and cars, while being wealthy is owning assets that provide passive income, as well as freedom and flexibility. Knowing the difference can reframe your life.

  • 21 March 2024

Why LICs may be close to bottoming

Investor disgust, consolidation, de-listings, price discounts, activist investors entering - it’s what typically happens at business cycle troughs, and it’s happening to LICs now. That may present a potential opportunity.

Latest Updates

Shares

Exploiting Warren Buffett

Growth investors are using Buffett to justify buying blue chip stocks at almost any price. It’s a recipe for potential disaster, as investors in market darlings like CBA and Cochlear may be about to find out.

Property

Population density trends and what they mean for housing

With Australia’s population moving through the fastest rate of growth since the 1950’s, our cities and towns are naturally densifying. This is a look at the latest trends and how they will impact the property market.

SMSF strategies

The ultimate superannuation EOFY checklist 2024

We're nearing the end of the financial year and it's time for SMSFs and other super funds to make the most of the strategies available to them. Here's a 24-point checklist of the most important issues to address.

Shares

The outlook for Nvidia, from a long-time investor

Nvidia has taken the world by storm and is now the third largest stock on the planet - larger than Meta, Amazon, and Alphabet. Here is the latest take on Nvidia from a fund manager who first invested in the company in 2016.

Economy

Gross National Happiness?

Despite being richer, surveyed measures of happiness have been flat to falling in Australia. Some suggest we should focus less on GDP and more on broader measures of wellbeing, and here are the pros and cons of that approach.

Shares

The power of dividends

In an era where growth companies dominate and the likes of Nvidia grab all of the attention, dividend paying stocks are flying under the radar. Some of these stocks offer compelling prospective returns.

Fixed interest

The best opportunities in fixed income right now

After more than a decade of pitiful yields, bonds are back offering better prospects for income investors. What are the best ways to take advantage of the market inefficiencies in Australian fixed income?

Sponsors

Alliances

© 2024 Morningstar, Inc. All rights reserved.

Disclaimer
The data, research and opinions provided here are for information purposes; are not an offer to buy or sell a security; and are not warranted to be correct, complete or accurate. Morningstar, its affiliates, and third-party content providers are not responsible for any investment decisions, damages or losses resulting from, or related to, the data and analyses or their use. To the extent any content is general advice, it has been prepared for clients of Morningstar Australasia Pty Ltd (ABN: 95 090 665 544, AFSL: 240892), without reference to your financial objectives, situation or needs. For more information refer to our Financial Services Guide. You should consider the advice in light of these matters and if applicable, the relevant Product Disclosure Statement before making any decision to invest. Past performance does not necessarily indicate a financial product’s future performance. To obtain advice tailored to your situation, contact a professional financial adviser. Articles are current as at date of publication.
This website contains information and opinions provided by third parties. Inclusion of this information does not necessarily represent Morningstar’s positions, strategies or opinions and should not be considered an endorsement by Morningstar.