The events of April 2025, when the S&P 500 plunged more than 10% in the first six trading sessions, only to recoup almost all of its losses by the end of the month, reignited the debate on the frequency of V-shaped recoveries. History has shown us that not all market corrections are short-lived; a small sell-off can precede a major fall in equity markets, as we saw in 2008 and 2020.
But is the current environment different? This is a question we are increasingly asked, reflecting concerns that post-COVID market dynamics and heightened policy uncertainty will be characterised by more rapid market snapbacks. We decided to investigate by examining the April 2025 rebound in the context of V-shaped recoveries through history.
April 2025 recovery: outlier or sign of a structural shift?
We first need clear criteria to identify V-shaped recoveries. We examine cumulative daily returns for the MSCI World since 2000 across all one-month (defined as overlapping 21-day) periods. In each period, we identify the lowest point of cumulative return and then identify the maximum values before and after that point. We then define the depth of the V-shaped recovery as the difference between the lower of the two maximum values and the minimum point, as illustrated below.
Figure 1. Defining a V-shaped recovery
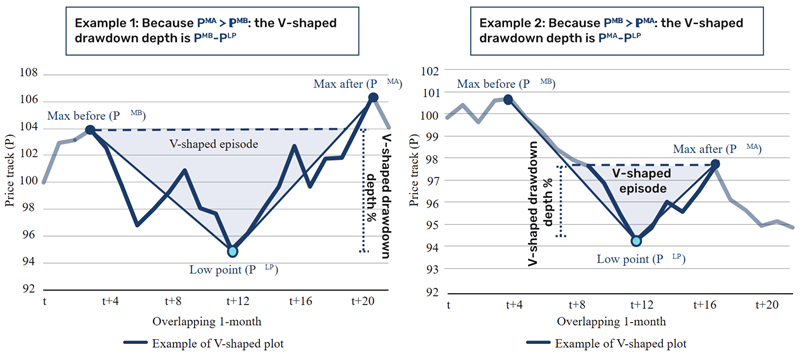
Schematic illustration. Source: Man Group, as of May 2025.
Figure 2 plots the deepest V-shaped recoveries in the MSCI World since 2000 by selecting the most pronounced reversal each year. It shows that April 2025 was among the steepest and sharpest moves to date, comparable to those V-shaped recoveries seen during major market downturns, including the dot-com bust, Global Financial Crisis (GFC) and COVID.
Figure 2. Maximum V-shaped recovery over one month by year for MSCI World since 2000
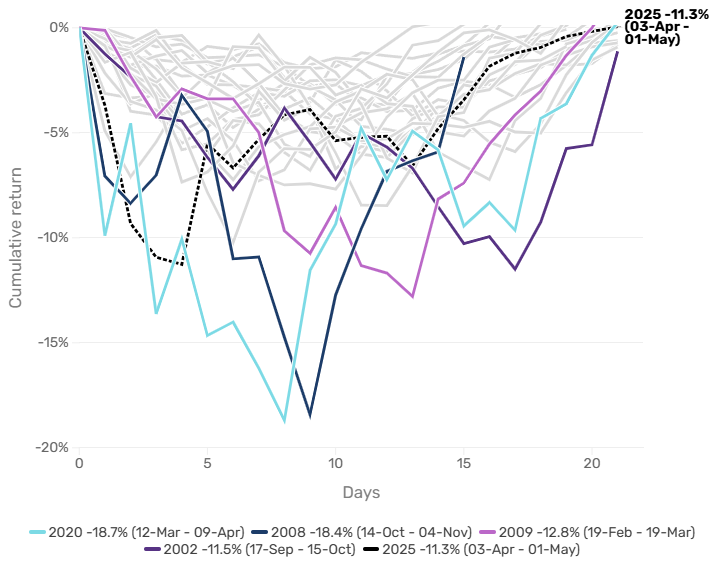
Date range: Jan 2000 – April 2025. Source: Internal Man Group Databases, Bloomberg.
Have V-shaped recoveries become more frequent?
Next, we examine one-month V-shaped recoveries of at least 5% (excluding overlaps) since 2000. The top chart in Figure 3 displays the MSCI World’s cumulative returns, with qualifying one-month recoveries highlighted in pink. The bottom chart shows the rolling five-year average number of events per year.
Figure 3. MSCI World returns, highlighting 5% V-shaped recoveries in one month
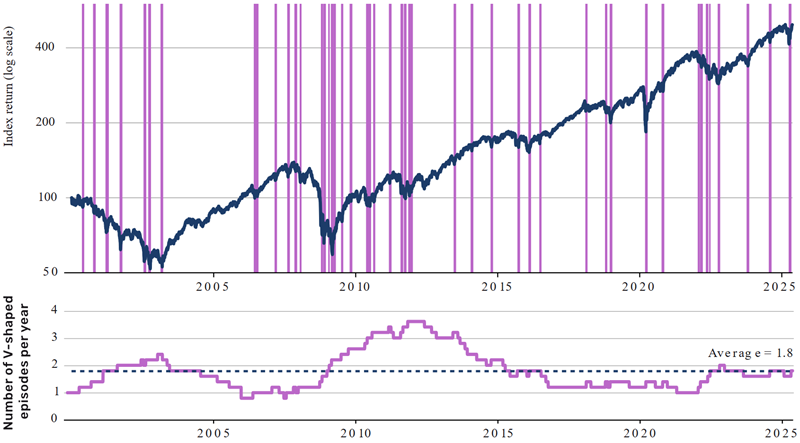
Date range: Jan 2000 – Apr 2025. Source: Bloomberg, Man Group Internal Databases.
While V-shaped recoveries occur more frequently amid heightened market volatility, our analysis shows that they have emerged across various market environments: during prolonged downturns (2001–2003), following marked corrections (2009 and 2020), and even within sustained bull market phases (2006 and 2014). Although April 2025's V-shaped recovery was notable for its speed and depth, Figure 3 does not suggest it was indicative of a broader, structural shift toward more frequent rapid rebounds. Instead, perhaps the notion that their frequency is increasing lends support to the Baader-Meinhof phenomenon, or frequency illusion, particularly when considering the recency of the ‘Yenmageddon’ event that interrupted 2024’s summer hiatus.
Is it different this time?
With all the above said, there are lingering questions about whether the current environment is unique relative to history. Given the US administration’s appetite for bold policy approaches and reversals, some investors are concerned that there may be more V-shaped recoveries in the near future. While this is certainly a possibility, it is dependent on some assumptions.
First, it assumes that markets do not adapt to new information. More specifically, reversals on broad-based reciprocal tariffs, Federal Reserve independence and China-specific tariffs mean market participants now have to price in the probability of policy U-turns. This is expected to lead markets to react less negatively to bold policy movements, thus creating lower risk of V-shaped recoveries.
Second, it assumes that these announcements can be effectively rolled-back. While any policy can technically be reversed, markets dislike such uncertainty. Financial theory suggests that when markets face repeated dramatic policy shifts, investors should demand higher risk premiums to hold assets, pushing prices lower. Continued V-shaped recoveries would suggest that the market is persistently agnostic to this risk.
We do not discount the prospect of increased volatility in markets, including further V-shaped recoveries. However, we strongly believe that markets are likely to incorporate the information available to them and adjust their reaction function accordingly.
Authors: Peter Weidner, Head of Total Return Strategies, Man AHL, Carl Hamill, Quantitative Analyst, Man AHL, Tarek Abou Zeid, Partner and Global Head of Client Portfolio Management, Otto van Hemert, Director of Core Strategies, Man AHL, Max Buchanan, Client Portfolio Management Analyst, at Man AHL. Man Group is a fund manager partner of GSFM, a Firstlinks sponsor. The information included in this article is provided for informational purposes only.
For more articles and papers from GSFM and partners, click here.