Register For Our Mailing List

Register to receive our free weekly newsletter including editorials.

Home / 617

A steady road to getting rich

The lists of Australia’s wealthiest individuals and families published annually by different media organisations are generally an interesting read.

Ranking them by their net wealth, they show that many of the richest Australians have progressively become richer over time through a combination of business expansion, market forces and shrewd investment decisions.

In fact, looking at the aggregate data compiled over the last five years alone, the estimated combined wealth of the top 200 wealthiest people in Australia has jumped by around 50% to over $670 billion.

Australia’s top ranks include individuals involved in resources, property, information technology, and investing. One could describe them as a diversified group of investors.

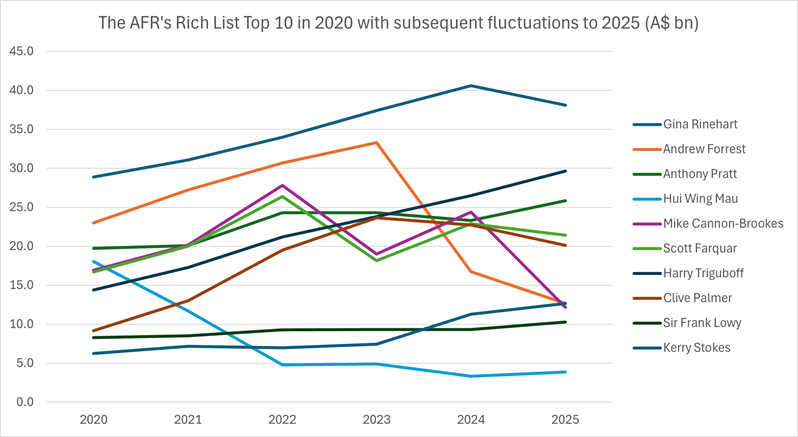
Yet, the real story behind the rich list rankings only becomes apparent when one digs a little deeper and compares how individual fortunes have changed from year to year.

The overall numbers have continued to increase, but the wealth gains by individuals have certainly not been uniform over time. In fact, among the top rankings, individual wealth levels have tended to shift up and down by billions of dollars from year to year.

Some individuals and families have managed to increase their fortunes every year, without fail. But others, because of unfavourable market conditions, poor investment decisions or a combination of both, have suffered losses over the same time and slipped down the overall rankings. Some have even fallen off the rich list entirely.


Source: Wikipedia, Financial Review Rich List [https://en.wikipedia.org/wiki/Financial_Review_Rich_List]

With the benefit of hindsight, those people may have chosen to do things differently.

Following a managed investment strategy

For example, as contrarian as it may sound, had the latter cohort – those who have slipped down or off the wealth rankings entirely – simply adhered to a managed investment strategy over the last five years instead of pursuing their business interests, their net worth now may actually be higher than it was in May 2020.

And the numbers supporting this strategy are even more compelling over longer periods of time, thanks to the compounding growth on global share markets.

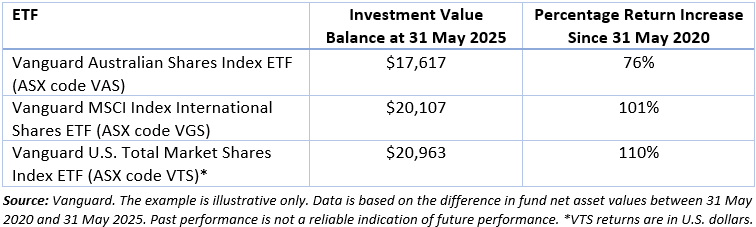
To illustrate this point, let’s compare the unit price returns over five years of three different Vanguard equities-based exchange traded funds (ETFs) based on an initial $10,000 investment back in April 2020.

They are the Vanguard Australian Shares Index ETF (VAS), the Vanguard MSCI Index International Shares ETF (VGS), and the Vanguard U.S. Total Market Shares Index ETF (VTS).

These particular ETFs have been chosen for illustrative purposes only because each closely tracks the broad performances of share markets in different parts of the world.

Here are the results, with the table below showing what a $10,000 investment made in May 2020 , during the early days of the COVID-19 pandemic, would have been worth on the Australian Securities Exchange (ASX) at 31 May 2025.

This data is based on each fund’s month-end net asset value (NAV), which is the value of its investments divided by the number of units in the fund. NAV movements give a good indicator of the historical performance of a fund, but they won't exactly match the returns you see as an investor. That's because your performance experience is based on the buy price (the price at which you buy into a fund) and the sell price (the price at which you sell).

The unit price returns exclude income distributions that were received by investors over the period.

Staying the course

What the numbers demonstrate is that, over the last five years, many investors using broad-based index funds that invest in different equities markets would have been well ahead by now, even without making any additional investments along the way.

Inputting higher initial deposit numbers, making regular investments in the same ETFs, and the reinvestment of distributions would obviously have produced even more impressive total returns.

And keep in mind that the last five years has included significant volatility following COVID and during the more recent economic, geopolitical and trade events.

The Vanguard Index Chart provides a much longer perspective over the last 30 years, showing the growth of different investment classes and how a starting balance of $10,000 would have changed in value after being invested into each asset class.

It’s a valuable lesson that at least some Australian rich listers have taken on board. In addition to expanding their business interests, it has been reported certain individuals have been investing heavily into ASX-listed and foreign-listed ETFs.

One could say they are hedging their investment bets.


Tony Kaye is a Senior Personal Finance writer at Vanguard Australia, a sponsor of Firstlinks. This article is for general information purposes only and does not consider the investment objectives, financial situation or needs of any individual.

For more articles and papers from Vanguard Investments Australia, please click here.


  •   25 June 2025
  • 10
  •      
  •   
10 Comments
Franco
June 26, 2025

Tony agree staying the course leads to compounding. However starting in May 2020 makes returns look great as this was a low point during Covid. Reminds me of something i read about the best long term results of individual investors in USA. It stated that they had passed away and no one had realised, their portfolios compounded.

Dudley
June 26, 2025

"passed away and no one had realised, their portfolios compounded": Dead men don't draw down.

Franco
June 27, 2025

True Dudley, that was an idea on the affect of compounding which does occur in Super to a large extent as its taxed at 15 % until retirement. If it Grows at 8% and you draw down 5% after retirement it will last along time.
However if you want to leave it all the children they may be a little less wealthy if you live too long.

Phil Kennon KC
June 27, 2025

$10,000 invested in VAS probably matches VGS and VTS returns over the period for an SMSF member in pension mode getting the benefit of 100 % franking.
So need to compare apples with apples.
Phil Kennon KC

David A
July 01, 2025

Vas 100% Franking?

Scott
June 29, 2025

Now divide those returns by either M2 or M3 and report back about ‘wealth creation’ and the cantillion effect.

Wildcat
June 29, 2025

As Franco points out convenient starting date, this is disingenuous.

Moreover it assumes 100% exposure to shares. This is also disingenuous. Very few people have this degree of beta risk in their portfolios. This is even less so of the very wealthy. They are typically very conservative.

The modelling also assumes zero taxation on annual income and/or realised cgt inside the trusts.

There’s nothing remotely relevant in this article other than the concept of comparing options. The actual analysis is so flawed it’s meaningless.

Kevin
June 29, 2025

It's the ideal time to start,the start of a decade.Everybody says you buy low,then they don't do that .
The years to start for this decade were 2000, 2010, 2020.A decade gives you a better picture.I'm still annoyed that companies stopped giving a 10 year history in their annual reports. The only one continuing that practice in my portfolio is Macbank,that 10 year history is great. No matter what information people are presented with the answer will always be 'you can't do that'.

Steve
June 29, 2025

Divorce had a major impact on Forrest & Cannon-Brookes, not mentioned here. Also, investors in Hub24 or Pinnacle would have thrashed any Index Fund investment over the past 5 years. Index Funds are the bare minimum return one should expect.

Kevin
June 29, 2025

Almost 10 years of 'you can't do that', 'those companies will go bust'. The Vanguard chart explains exactly what people refuse to see and don't want to know about.
Compounding.
I found the margin loan statement for 30/6/16.I'd put them back into the plastic protector in the wrong order. It is 2016 purely because the margin loan was taken out around 1995 or 1996. So 10 year periods from then on.That first statement is the start of the 10 year period we are in now. The 3 big drivers and NAB . All 30/6/16 start date
CBA $74.37 each
Macbank $68. 90 each
WES $40.10.

NAB ( head in hands ) $25.43 each .

Spin outs were Macbank spun out Sydney airport,that may have been earlier than 2016,SYD isn't on the list because I just told them to sell them.
WES spun out Coles, so that price would need to be added to the WES price.The spin out was 1 for 1.
NAB spun out Virgin money on a 1 for 4 basis.
So in 9 years you've tripled your money on those 4 shares easily.

I'm nearly certain somebody said compounding is the 8th wonder of the world.I wonder if those companies will be around for the rest of my life,I think they will. As the statements are mid decade they are great for 25 years periods 2000 to 2025,then 2025 to 2050.

That Vanguard chart is great to show what needs to be understood,long term compounding. As Tony said,the bigger the number is at the start,the bigger the number is at the end,I think the margin loan started at $100K for me back then,then it worked in tandem with a line of credit on a property taken out earlier than the margin loan


Leave a Comment:

RELATED ARTICLES

Shaky markets, steady mind

Winning by not losing: The silver rule of investing

The BIG picture: portfolios perform for the passive and patient

banner

Most viewed in recent weeks

Ray Dalio on 2025’s real story, Trump, and what’s next

The renowned investor says 2025’s real story wasn’t AI or US stocks but the shift away from American assets and a collapse in the value of money. And he outlines how to best position portfolios for what’s ahead.

Making sense of record high markets as the world catches fire

The post-World War Two economic system is unravelling, leading to huge shifts in currency, bond and commodity markets, yet stocks seem oblivious to the chaos. This looks to history as a guide for what’s next.

3 ways to fix Australia’s affordability crisis

Our cost-of-living pressures go beyond the RBA: surging house prices, excessive migration, and expanding government programs, including the NDIS, are fuelling inflation, demanding bold, structural solutions.

Is there a better way to reform the CGT discount?

The capital gains tax discount is under review, but debate should go beyond its size. Its original purpose, design flaws and distortions suggest Australia could adopt a better, more targeted approach.

How cutting the CGT discount could help rebalance housing market

A more rational taxation system that supports home ownership but discourages asset speculation could provide greater financial support to first home buyers.

Welcome to Firstlinks Edition 648 with weekend update

This is my last edition as Editor of Firstlinks. I’m moving onto a new role though the newsletter will remain in good hands until my permanent replacement is found.

  • 5 February 2026

Latest Updates

Property

The 5% deposit scheme is bad for homeowners and Australia

An ‘affordability’ scheme making the county more vulnerable to economic shocks and contributing to the deteriorating financial situation of everyday Australians.

Investment strategies

Is defensive the new offensive?

Relatively boring, unglamorous, defensive stocks like Kroger and Allstate have quietly outperformed gilded tech giants, offering steady growth, visibility, and resilient returns in a market captivated by AI and flashier industries.

Shares

How the RBA scores on its inflation goal

The Reserve Bank continues to face criticism from all sides. A reminder of the RBA's mandate and a review of their track record in maintaining price stability since the early 1990s.

Investment strategies

Levered credit: A late cycle ingredient for drawdown pain

As credit spreads normalised through 2025, yield‑hungry investors have turned to leverage for high returns, uncomfortably echoing pre‑GFC behaviours. Investors need to be careful to understand the true risk‑return trade‑off.

Planning

The more things change… longevity just goes on increasing

Australia needs a major shift in longevity awareness, attitudes and behaviour if, as a community, we are to reap the benefits of increasing longevity. Adopting a national strategy is well overdue.

Property

The improving outlook of Australian commercial real estate

The sector is positioned to benefit from defensive and resilient income streams supported by embedded rental increase opportunities. 

Property

Seize hidden opportunities among 50+ home buyer schemes in Australia

There is a laundry list of government schemes to help Australian's struggling with housing affordability. Savvy buyers should take advantage to break into the property market.

Sponsors

Alliances

© 2026 Morningstar, Inc. All rights reserved.

Disclaimer
The data, research and opinions provided here are for information purposes; are not an offer to buy or sell a security; and are not warranted to be correct, complete or accurate. Morningstar, its affiliates, and third-party content providers are not responsible for any investment decisions, damages or losses resulting from, or related to, the data and analyses or their use. To the extent any content is general advice, it has been prepared for clients of Morningstar Australasia Pty Ltd (ABN: 95 090 665 544, AFSL: 240892), without reference to your financial objectives, situation or needs. For more information refer to our Financial Services Guide. You should consider the advice in light of these matters and if applicable, the relevant Product Disclosure Statement before making any decision to invest. Past performance does not necessarily indicate a financial product’s future performance. To obtain advice tailored to your situation, contact a professional financial adviser. Articles are current as at date of publication.
This website contains information and opinions provided by third parties. Inclusion of this information does not necessarily represent Morningstar’s positions, strategies or opinions and should not be considered an endorsement by Morningstar.