Register For Our Mailing List

Register to receive our free weekly newsletter including editorials.

Home / 520

The BIG picture: portfolios perform for the passive and patient

One of the most important, but difficult, aspects of long-term investing is learning to not let day-to-day market chatter and scaremongering media headlines affect your long-term strategies. Although I keep a close eye on financial markets daily (mainly to respond to a daily email inbox full of panicking punters), I look at my own long-term portfolio only once or twice per year, typically during the January break, and at financial year-end.

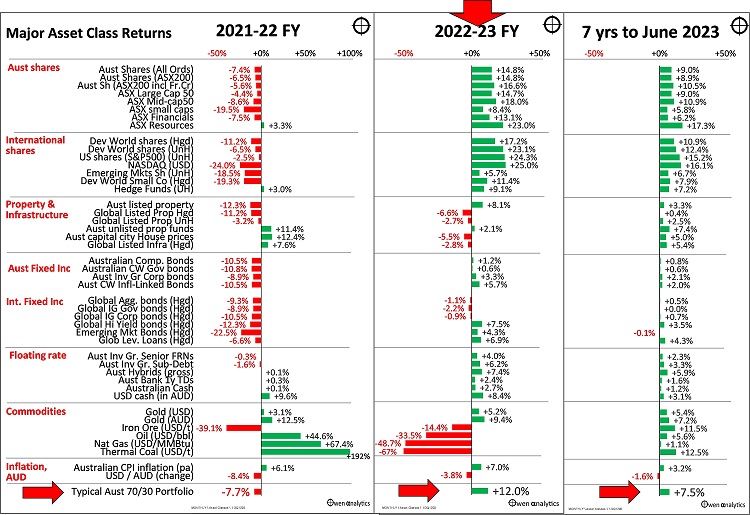
Looking through the day-to-day volatility and market chatter, the charts below show returns from the main asset classes for the 2022-23 financial year (middle chart), plus some other related data (commodities prices, inflation, exchange rate – in the lower section).


Click to enlarge

In the upper two sections of the middle chart, we see that in the 2022-23 financial year to June, share markets posted double-digit gains (with the best gains in recession-plagued Europe), while real estate markets (including housing) were hurt by rising interest rates, and bonds were more or less flat.

It is notable that returns on all asset classes were much better in 2022-23 than in the prior (2021-22) financial year, despite the fact that 2022-23 was the year of high inflation, aggressive interest rate hikes, quantitative tightening, crises in US regional banks and Switzerland, global slowdown fears, recessions in Europe, and declining global profits.  

Diversified portfolios

The bottom line on each chart shows returns on a typical Australian diversified ‘70/30’ portfolio (70% ‘growth’ and 30% ‘defensive’ assets, which is in line with most large Super fund ‘Growth’ options, and also commonly their ‘default’ funds). In our hypothetical 70/30 portfolio, the ‘growth’ side has an even mix of Australian and international shares, with 50% currency hedging.

The ‘defensive’ side has Australian and international fixed income (bonds), plus 5% allocation to 1-year bank TDs, and 5% in cash, to negate ‘sequencing risk’ - ie a couple of years of living expenses in cash and short-term TDs so we don’t need to sell assets when asset prices are down.

These are just the basic asset classes, and each can be bought at very low cost by ordinary investors using ASX-listed ETFs, and/or unlisted passive index funds.

This is just a passive portfolio with no fiddling, no active funds, and no chasing hot fads. Just a boring mix of rather boring, low-cost, passive index ETFs/funds. (The returns discussed below are before fees, so the after-fee returns from passive funds/ETFs would be an average of around 0.2% lower).

In 2022-23 (middle chart), this standard passive diversified portfolio returned a very healthy 12% for the year, despite the doom and gloom of war in Europe, inflation, rate hikes, Chinese slowdown, recession in Europe, etc. If your long-term portfolio did not achieve these returns, ask your fund or portfolio manager for a detailed explanation of why.

The good returns in 2022-3 more than made up for the -8% negative return on the same portfolio for the prior financial year (left chart). The portfolio returned +21% in the 2020-21 financial year but was dead flat in 2019-20.

CPI+4% pa return target achieved over 7 years

These are long term portfolios, so we need to look beyond just annual returns. As this is a ‘growth’ portfolio with 70% in shares, we need to take at least a seven-year view. Average annual returns over the past seven years to June 2023 shows a sea of green across all asset classes, with modest positive returns across the board, although it is notable that all asset classes returned a little below their long-term historical averages.

Even with below average returns, our boring passive diversified 70/30 portfolio would have returned a respectable average annual return of 7.5% per year (less a fraction for passive index fund fees). This was more than 4% above the average inflation rate over the period (3.2% pa).

Why do we focus on a ‘CPI+4%’ total return goal? If a portfolio is able to generate long term average total returns after fees of CPI+4% pa, and holds enough cash to handle sequencing risk so we can avoid selling assets to fund withdrawals when prices are low, then it can allow a withdrawal rate of 4% of capital (4% is where the minimum withdrawal rate from super pension accounts start), and allow both the cash withdrawals, and the remaining capital after withdrawals, to keep growing to keep pace with inflation (ie. withdrawals and capital value maintain their real values) over time.

Over the past seven years, our boring diversified portfolio of passive index funds exceeded the critical CPI+4% target returns, despite the global pandemic lockdowns, the sharpest and deepest economic recessions in every country since the 1930s Great Depression, the turbulent Trump years, trade wars, war in Europe, ‘Brexit’, political turmoil and fragmentation across the world, the worst inflation spikes in 40 years, various banking crises, numerous corporate bankruptcies, and a host of other things to scare off investors.

Seven years ago, nobody could have predicted that events would turn out to be as bad as they did, but simple, diversified portfolios did just fine through it all!

That is the past, of course, but we are interested in the future. Although the future is unknowable, we can assume that future events will probably be just as interesting and challenging as the past, but we can also suggest that a simple diversified portfolio of low-cost funds will continue to have a good chance of generating the required returns we need in the long term.


Ashley Owen, CFA is Founder and Principal of Owen Analytics. Ashley is a well-known Australian market commentator with over 40 years’ experience. This article is for general information purposes only and does not consider the circumstances of any individual.


7 Comments
Peter Thornhill
August 06, 2023

The reason I left the financial services industry after more than 40 years was because I could no longer advise people to invest in a manner that I no longer found acceptable. I chose to drop the under performing asset classes and stick to the 'value' sector, shares, the productive engine room of the nation. A quick glance today at the results show that both my personal portfolio and our SMSF, since my departure in 2000, have returned approx 11.5% p.a. compound compared to the S&P ASX200 accum index of 7.76. Whilst I acknowledge that many people do not have the stomach for shares, every investor should be alerted to the long term cost of holding, dare I call them, defensive assets!

ashley owen
August 07, 2023

hi peter,
thanks for your comments!
1) on your own returns -v- ASX, well done - probably a big part of it was not holding dot-com bubble stocks (in Aust the biggest dot-com bubble stocks were Telstra + News (!) - perennial dogs for different reasons).
2) on 'defensive' bonds - i agree. They are only 'defensive' because finance textbooks were mostly written in the past 30 years, which were the wonderful disinflation years when bonds posted high returns + negative/low correlations to shares. But over longer periods they are lousy (eg Graham, Dodd, etc)
cheers
ashley

Peter Thornhill
August 08, 2023

Thanks Ashley. I must confess to having held Telstra (no NEWS) for many years. Price has been disappointing, little gain, but the consolation is that the dividends have paid me back much more than I invested.

Steve G
August 06, 2023

The risk and lost opportunity cost of no gains for years before bouncing back to an average 4% over CPI and where those funds are electively illiquid to avoid impairment, makes this asset class very average in my opinion. There are better options.

David O
August 06, 2023

I started investing in early 2009 and bought some great companies at the bottom of the GFC. However, I have a subset of those that have reached and then fallen from their zenith in the meantime. There is still a prudent time to sell.

Trevor Stewart
August 05, 2023

Thanks for the article. If it’s a long term investment is it really necessary to hedge the currency?

Dudley
August 03, 2023

Three ages of Homo investicus:

. Capital formation - saving more significant than:
. Return on capital - risk vs reward:
. Capital disbursement - return of capital more significant than return on capital.


Leave a Comment:

RELATED ARTICLES

Even Warren Buffett lost his edge 20 years ago

A one-page introduction to investing

Shaky markets, steady mind

banner

Most viewed in recent weeks

Australian house prices close in on world record

Sydney is set to become the world’s most expensive city for housing over the next 12 months, a new report shows. Our other major cities aren’t far behind unless there are major changes to improve housing affordability.

The case for the $3 million super tax

The Government's proposed tax has copped a lot of flack though I think it's a reasonable approach to improve the long-term sustainability of superannuation and the retirement income system. Here’s why.

7 examples of how the new super tax will be calculated

You've no doubt heard about Division 296. These case studies show what people at various levels above the $3 million threshold might need to pay the ATO, with examples ranging from under $500 to more than $35,000.

The revolt against Baby Boomer wealth

The $3m super tax could be put down to the Government needing money and the wealthy being easy targets. It’s deeper than that though and this looks at the factors behind the policy and why more taxes on the wealthy are coming.

Meg on SMSFs: Withdrawing assets ahead of the $3m super tax

The super tax has caused an almighty scuffle, but for SMSFs impacted by the proposed tax, a big question remains: what should they do now? Here are ideas for those wanting to withdraw money from their SMSF.

The super tax and the defined benefits scandal

Australia's superannuation inequities date back to poor decisions made by Parliament two decades ago. If super for the wealthy needs resetting, so too does the defined benefits schemes for our public servants.

Latest Updates

Planning

Will young Australians be better off than their parents?

For much of Australia’s history, each new generation has been better off than the last: better jobs and incomes as well as improved living standards. A new report assesses whether this time may be different.

Superannuation

The rubbery numbers behind super tax concessions

In selling the super tax, Labor has repeated Treasury claims of there being $50 billion in super tax concessions annually, mostly flowing to high-income earners. This figure is vastly overstated.

Investment strategies

A steady road to getting rich

The latest lists of Australia’s wealthiest individuals show that while overall wealth has continued to rise, gains by individuals haven't been uniform. Many might have been better off adopting a simpler investment strategy.

Economy

Would a corporate tax cut boost productivity in Australia?

As inflation eases, the Albanese government is switching its focus to lifting Australia’s sluggish productivity. Can corporate tax cuts reboot growth - or are we chasing a theory that doesn’t quite work here?

Are V-shaped market recoveries becoming more frequent?

April’s sharp rebound may feel familiar, but are V-shaped recoveries really more common in the post-COVID world? A look at market history suggests otherwise and hints that a common bias might be skewing perceptions.

Investment strategies

Asset allocation in a world of riskier developed markets

Old distinctions between developed and emerging market bonds no longer hold true. At a time where true diversification matters more than ever, this has big ramifications for the way that portfolios should be constructed.

Investment strategies

Top 5 investment reads

As the July school holiday break nears, here are some investment classics to put onto your reading list. The books offer lessons in investment strategy, financial disasters, and mergers and acquisitions.

Sponsors

Alliances

© 2025 Morningstar, Inc. All rights reserved.

Disclaimer
The data, research and opinions provided here are for information purposes; are not an offer to buy or sell a security; and are not warranted to be correct, complete or accurate. Morningstar, its affiliates, and third-party content providers are not responsible for any investment decisions, damages or losses resulting from, or related to, the data and analyses or their use. To the extent any content is general advice, it has been prepared for clients of Morningstar Australasia Pty Ltd (ABN: 95 090 665 544, AFSL: 240892), without reference to your financial objectives, situation or needs. For more information refer to our Financial Services Guide. You should consider the advice in light of these matters and if applicable, the relevant Product Disclosure Statement before making any decision to invest. Past performance does not necessarily indicate a financial product’s future performance. To obtain advice tailored to your situation, contact a professional financial adviser. Articles are current as at date of publication.
This website contains information and opinions provided by third parties. Inclusion of this information does not necessarily represent Morningstar’s positions, strategies or opinions and should not be considered an endorsement by Morningstar.