Register For Our Mailing List

Register to receive our free weekly newsletter including editorials.

Home / 652

AFL Final Ten with wildcard edit 'unlevels' the field

The AFL has announced a move this season to a Final Ten by adding a ‘wildcard’ round to its existing Final Eight format. But has it got the formula right?

First, a recap of the Final Eight system that has been in place since 2000, according to final ladder positions.

Week 1

  • Game One: 1 v 4
  • Game Two: 2 v 3
  • Game Three: 5 v 8
  • Game Four: 6 v 7

Week 2

  • Game Five: loser One v winner Three
  • Game Six: loser Two v winner Four

Week 3

  • Game Seven: winner One v winner Six
  • Game Eight: winner Two v winner Five

Week 4

  • Grand Final: winner Seven v winner Eight

We also assess the fairness of this finals format by determining the premiership chances for each team implied solely by the finals structure. This is done by assuming that each final is a 50:50 contest. Such an approach strips out external influences like home ground advantage, form, injuries, and so on, leaving the finals system itself as the sole determinant of premiership prospects.

Possible paths to premiership for teams 1 to 4, and premiership winning probabilities:

  • Path 1: win week1 - win week 3 - win week 4.
    Assuming a 50% probability of winning per final, probability of a premiership via this path = 0.5 x 0.5 x 0.5 = 12.5%. That is, in shorthand notation: W-W-W = 0.5 x 0.5 x 0.5 = 12.5%.
  • Path 2: lose week 1 - win week 2 - win week 3 - win week 4.
    That is, L-W-W-W = 0.5 x 0.5 x 0.5 x 0.5 = 6.25%.

Therefore, total probability of winning the premiership, teams 1 to 4 = 12.5% + 6.25% = 18.75%.

Path to premiership for teams 5 to 8, and premiership winning probabilities (there is only one path possible): W-W-W-W = 0.5 x 0.5 x 0.5 x 0.5 = 6.25%.

(Check: teams 1 to 8 probabilities sum to 100%)

Now many AFL diehards would remember the old Page-McIntyre Final Four system that was in place in the VFL from 1931 to 1971. It worked as follows:

Week 1

  • Game One: 1 v 2
  • Game Two: 3 v 4

Week 2

  • Game Three: loser One v winner Two

Week 3

  • Grand Final: winner One v winner Three

In the same vein as above, the premiership winning probabilities are (again assuming 50% win probability per final):

  • Teams 1 & 2: W-W or L-W-W = (0.5 x 0.5) + (0.5 x 0.5 x 0.5) = 37.5%
  • Teams 3 & 4: W-W-W = 0.5 x 0.5 x 0.5 = 12.5%

But why consider the old Final Four premiership winning probabilities?

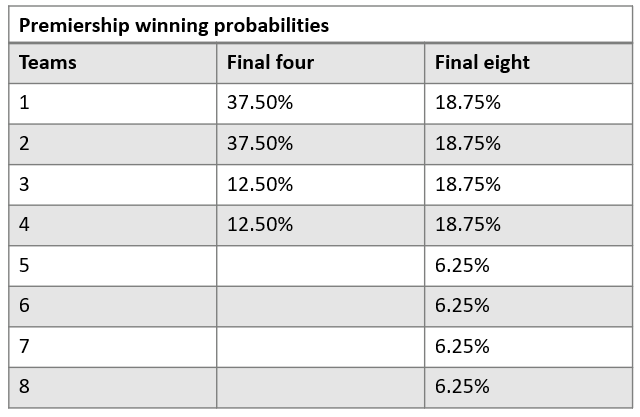
Because teams 1 and 2 probabilities (Final Four) at 37.5% = twice that of teams 1 to 4 (Final Eight) at 18.75%. And teams 3 and 4 (Final Four) at 12.5% = twice that of teams 5 to 8 (Final Eight) at 6.25%.

And this is because the Final Eight system is basically two Final Four conferences: teams 1, 4, 5, and 8, and teams 2, 3, 6, and 7 (with conference crossover in week 3). The winners of each Final Four, play off in the grand final.

Hence Final Eight premiership probabilities = 0.5 x Final Four probabilities. The 0.5 factor reflecting the extra win required. In summary:

Table 1

Given all that, wouldn’t the natural progression from a Final Eight to a Final Ten, be two Final Five conferences (with crossover)? Rather than a ‘wildcard-fed’ Final Eight?

Consider the McIntyre Final Five system from 1975 to 1990. That finals format progressed as follows:

Week 1

  • Game One: 2 v 3
  • Game Two: 4 v 5

Week 2

  • Game Three: 1 v winner One
  • Game Four: loser One v winner Two

Week 3

  • Game Five: loser Three v winner Four

Week 4

  • Grand Final: winner Three v winner Five

And the premiership winning probabilities are:
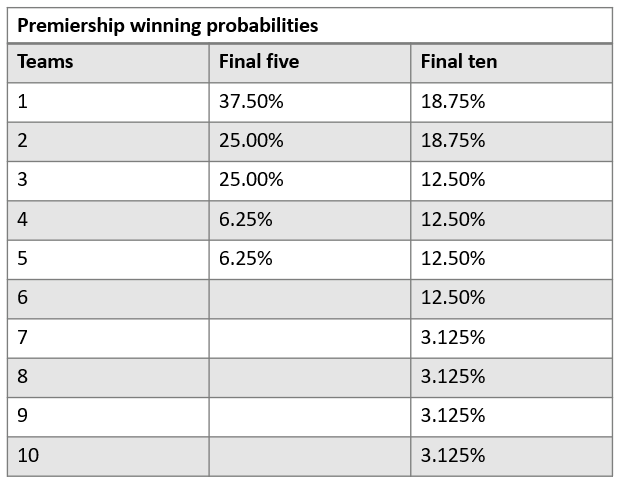
  • Team 1: 37.50%
  • Teams 2 & 3: 25.00%
  • Teams 4 & 5: 6.25%

(See Footnote for Final Five probabilities detail).

It follows then that a ‘two-conference’ Final Ten will have probabilities: 0.5 x Final Five probabilities, yielding:

Table 2

In order to compare the ‘two-conference’ Final Ten, with the ‘wildcard’ Final Ten, we also need the premiership winning probabilities under the wildcard system.

The ‘wildcard’ Final Ten has teams 7 v 10, and 8 v 9 in the first week of the finals, to determine positions 7 and 8 for the Final Eight format commencing in week 2.

These four teams will therefore now need to win five games to take out the premiership. The probability being: 0.5 x 0.5 x 0.5 x 0.5 x 0.5 = 3.125%.

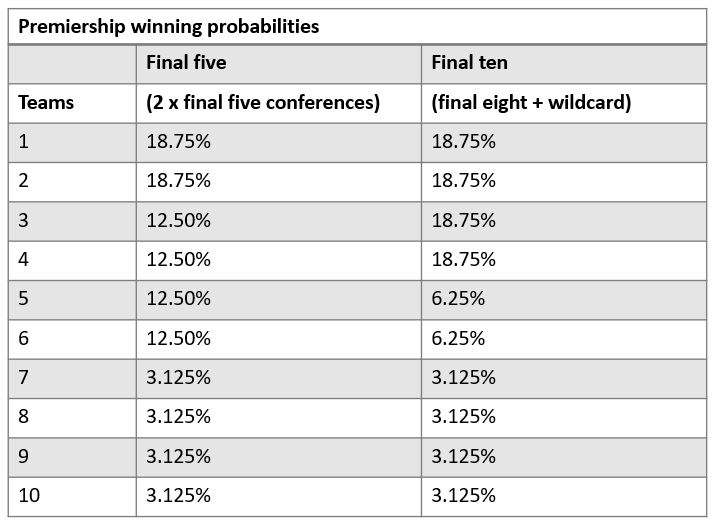
Premiership winning chances for teams 1 to 6 remain unchanged from Table 1. We have then:

Table 3

Observations:

  • The commercial logic from an AFL point of view in moving to a ‘wildcard’ Final Ten, is two extra finals, with more teams ‘alive’ deeper into the season, and less ‘dead’ rubbers. But the motivation might seem to be more commercial than competitive.
  • Teams 7 and 8 are the big losers in going from a Final Eight to a Final Eight ‘plus wildcard’ format, with their probabilities halving from 6.25% to 3.125%. They have gone from having some semblance of a chance of winning the premiership (à la the Western Bulldogs in 2016 when they won from 7th) to realistically just now making up the numbers.
  • However, the same small probabilities for teams 7 and 8 also emerge in the Final Ten conference model. A consequence perhaps of any Final Ten, that the bottom rung teams have little chance. Unless a format was devised over more than five weeks, but that’s one for another day.
  • The ‘two-conference’ Final Ten version, genuinely rewards the top team in each conference, with the winning probabilities of those two teams superior to teams following. Better teams should have higher chances, and the conference model achieves that.
  • Table 3 shows probabilities invariant for teams 1 and 2, and teams 7 to 10, with all redistribution occurring between teams 3 to 6. But that redistribution is key to competitive balance.
  • The two-conference format smooths out probabilities for the mid-rung teams, with teams 3 to 6 enjoying the same reasonable winning chance of 12.5%. And probabilities progress in a smoother fashion from top to mid, unlike the wildcard version, where there is a ‘cliff effect’, with winning chances plummeting from team 4 to team 5 (18.75% to 6.25%).
  • Under the two-conference system, there would be two more finals than the wildcard version, 13 finals versus 11, both played over five weeks. And so would be even more of a commercial win for the AFL. If the objective is additional content, the ‘two-conference’ Final Ten dominates the wildcard model commercially.

Overall, a Final Ten conference format offers a smoother and more coherent finals structure. Premiership chances are more graduated, and it genuinely rewards the top two teams over the rest, while utilising arguably the best finals format the VFL/AFL has ever implemented, in the McIntyre Final Five system.

The ‘add-on’ of a wildcard round, however, gatecrashes a proven Final Eight format rather than integrating with it. A wildcard approach appears to be a rushed decision that comes at the expense of competitive balance, without exploring alternatives that are fairer, more logical, and better aligned with ladder outcomes.


Tony Dillon is a freelance writer and former actuary. This article is general information and does not consider the circumstances of any investor.


Footnote

McIntyre Final Five premiership paths and probabilities:

  • Team 1: win week 2 – win week 4 or lose week 2 – win week 3 – win week 4:
    W-W, or L-W-W = (0.5 x 0.5) + (0.5 x 0.5 x 0.5) = 37.50%
  • Teams 2 & 3: win week 1 – win week 3 – win week 4 or lose week 1 – win week 2 – win week 3 – win week 4 or win week 1 – lose week 2 – win week 3 – win week 4:
    W-W-W, or L-W-W-W, or W-L-W-W = (0.5 x 0.5 x 0.5) + 2 x (0.5 x 0.5 x 0.5 x 0.5) = 25.00%
  • Teams 4 & 5: win week 1 – win week 2 – win week 3 – win week 4:
    W-W-W-W = (0.5 x 0.5 x 0.5 x 0.5) = 6.25%


  •   4 March 2026
  • 8
  •      
  •   
8 Comments
Julian
March 05, 2026

Maybe you should have a word to your brother about this Tony?

In a related discussion - the length of the season (post 2027 Test Cricket Sesquicentenary) should be Labour Day Weekend in Melbourne through to 2nd Saturday of October (after Daylight Savings comes in - which allows the Grand Final to be played "earlier" 1 hour later - you could start the game 90mins later at almost the "identical" time of day)

2026: March 7 - October 10: 31 weeks
2028: March 11 - October 14: 31 weeks
2029: March 10 - October 13: 31 weeks
2030: March 9 - October 12: 31 weeks

As you can see - that gives 31 weeks to play with - and you can perhaps play 25 Rounds (24 Matches) and 5 Weeks of Finals, with an extra bye week in there.

Happy to discuss with you Tony - [email protected]

1
Tony Dillon
March 06, 2026

"Maybe you should have a word to your brother about this Tony?"

Ha, yes. Actually I had a brother Andrew. Sadly we lost him when he was young.

Thanks, I will contact you Julian.

Maurie
March 05, 2026

Finishing 9th or 10th - imagine that is an interstate side. In all likelihood, would have to travel for 5 straight weeks (if they happen to get GF). They may have to enlist the services of Steven Bradbury as a motivational speaker!

1
Steve
March 05, 2026

Simple question - how do your chances of winning stack up against the actual outcomes? Each game is classed as 50/50 which of course is a simplification. Teams finishing at the top should beat teams at the bottom of the eight more than 50% of the time. Of course no room to discuss byes or momentum, two significant factors as well. But a good fun start to the footy season.

Tony Dillon
March 05, 2026

Hi Steve, the 50:50 assumption is made to assess the premiership chances afforded by the 'finals structure' only. It strips out everything else. I said this in the article:

"We also assess the fairness of this finals format by determining the premiership chances for each team implied solely by the finals structure. This is done by assuming that each final is a 50:50 contest."

A simple example. Take a final four, 1 v 2 and 3 v 4. Winners play off for the premiership. Finals structure winning odds for all teams = 0.5 x 0.5 = 25% (two wins required for the premiership). That is, no team has a 'structural' advantage with that finals system because it is a knock-out format in every game.

So what I am saying, the chances I have calculated in the article are before any other factors. Start layering in form, home ground, injuries etc, and those premiership winning chances begin to change because games won't be 50:50. It's just that teams higher up the ladder have a better underlying advantage before anything else, as far as overall chances are concerned, because the finals systems are structured to favour those higher ranked teams. None of the finals systems in the article are knock-out format in all games, that's why format premiership chances are not equal for all teams.

The overall chances calculated for each team are not intended to be true premiership winning odds. Rather, it is a means to calculate relativities of winning between teams according to the finals format. It also enables comparisons of different finals formats. Hope that helps.

Nadal
March 05, 2026

10 teams make the finals, 8 miss out. Why is mediocrity rewarded? Is it only about raising revenue? If it is, then why not have a top 18 finals system? Every one gets a prize then, just like at primary school.

Steve
March 05, 2026

AFL, like NRL is a business and it is certainly about raising revenue. More teams implies the need for a larger finals ladder - often top 4 was when you only had 8 or 10 teams. But the bigger problem is the talent pool is not deep enough to support 18 or more teams. The kicking at goal, particularly set shots is nothing short of pathetic for so-called "elite" players. 30 metres out, nearly straight in front and not many people would put large sums on a bet it'll go through.


Leave a Comment:

RELATED ARTICLES

Breaking down recent footy finals by the numbers

The changing face of finals footy and the numbers behind it

banner

Most viewed in recent weeks

How cutting the CGT discount could help rebalance housing market

A more rational taxation system that supports home ownership but discourages asset speculation could provide greater financial support to first home buyers.

Want your loved ones to inherit your super? You can’t afford to skip this one step

One in five Australians die before retirement and most have not set up their super properly so their loved ones can benefit from all their hard work and savings. 

Super is catching up, but ageing is a triple-threat

An ageing Australia is shifting the superannuation system’s focus from accumulation to the lifecycle of retirement. While these pressures have been anticipated for decades, they are now converging at scale and driving widespread industry change.

Has Australia wasted the last 30 years?

The 20 years after Peter Costello left Treasury have been deemed wasted...by Peter Costello. The missed opportunities for Australia began long before.  

Meg on SMSFs: Last word on Div 296 for a while

The best way to deal with the incoming Division 296 tax on superannuation is likely doing nothing. Earnings will be taxed regardless of where the money sits, so here are some important considerations.

The 5% deposit scheme is bad for homeowners and Australia

An ‘affordability’ scheme making the county more vulnerable to economic shocks and contributing to the deteriorating financial situation of everyday Australians.

Latest Updates

Investment strategies

The thin line between investing and gambling

Prediction markets are blurring the line between investing and speculation and savvy investors can profit from this trend by heeding the advice of famed investor, Benjamin Graham.

Strategy

The refinery problem: A different kind of energy crisis in 2026

The Strait of Hormuz closure due to US-Iran conflict severely disrupted global energy supply chains. While various emergency measures mitigated the crude impact, the refined product market faces unprecedented stress.

Gold

Are we running out of gold?

Geopolitical instability and challenges with new gold discoveries mean we may be approaching a structural shortage of mineable gold, but what does this mean for gold's overall long-term availability?

Investment strategies

ETF investors adding to portfolios during recent volatility

In the face of recent market volatility investors continue to add to their ETF portfolios with these ETFs getting notable inflows, indicating that long-term fundamentals remain solid.

Strategy

Policy setting in democracies

Democracies aren’t a given, and policymakers need to be mindful not to alienate communities and instead be more aligned with mainstream ideas and attitudes. 

Investment strategies

Take my money and lie to me… again

As private funds increasingly show signs of cracking and buckling under a complete lack of liquidity, the salespeople do their best to keep the cash pouring in from new investors. 

Economy

Australia was once a world leader in innovation, now the system is ‘broken’

Ambitious Australia joins a long line of reports examining research and development, finding Australia has fallen behind its peers on many fronts. It urges bold reform to address declining productivity and research spending.

Sponsors

Alliances

© 2026 Morningstar, Inc. All rights reserved.

Disclaimer
The data, research and opinions provided here are for information purposes; are not an offer to buy or sell a security; and are not warranted to be correct, complete or accurate. Morningstar, its affiliates, and third-party content providers are not responsible for any investment decisions, damages or losses resulting from, or related to, the data and analyses or their use. To the extent any content is general advice, it has been prepared for clients of Morningstar Australasia Pty Ltd (ABN: 95 090 665 544, AFSL: 240892), without reference to your financial objectives, situation or needs. For more information refer to our Financial Services Guide. You should consider the advice in light of these matters and if applicable, the relevant Product Disclosure Statement before making any decision to invest. Past performance does not necessarily indicate a financial product’s future performance. To obtain advice tailored to your situation, contact a professional financial adviser. Articles are current as at date of publication.
This website contains information and opinions provided by third parties. Inclusion of this information does not necessarily represent Morningstar’s positions, strategies or opinions and should not be considered an endorsement by Morningstar.