Here’s my go-to chart on the BIG Picture on inflation over the past 150 years. Here we are talking about serious long-term investing.
Over the past few decades, I have advised (and mentored advisors for) serious long-term investors, including family offices, perpetual charities and endowments, where investment time frames are measured in generations, not just in decades and years.
But for mere mortals like me and ordinary investors and retirees, it is also useful to look at the big picture to understand where we are in the grand scheme of things, for an insight into where we may be heading.
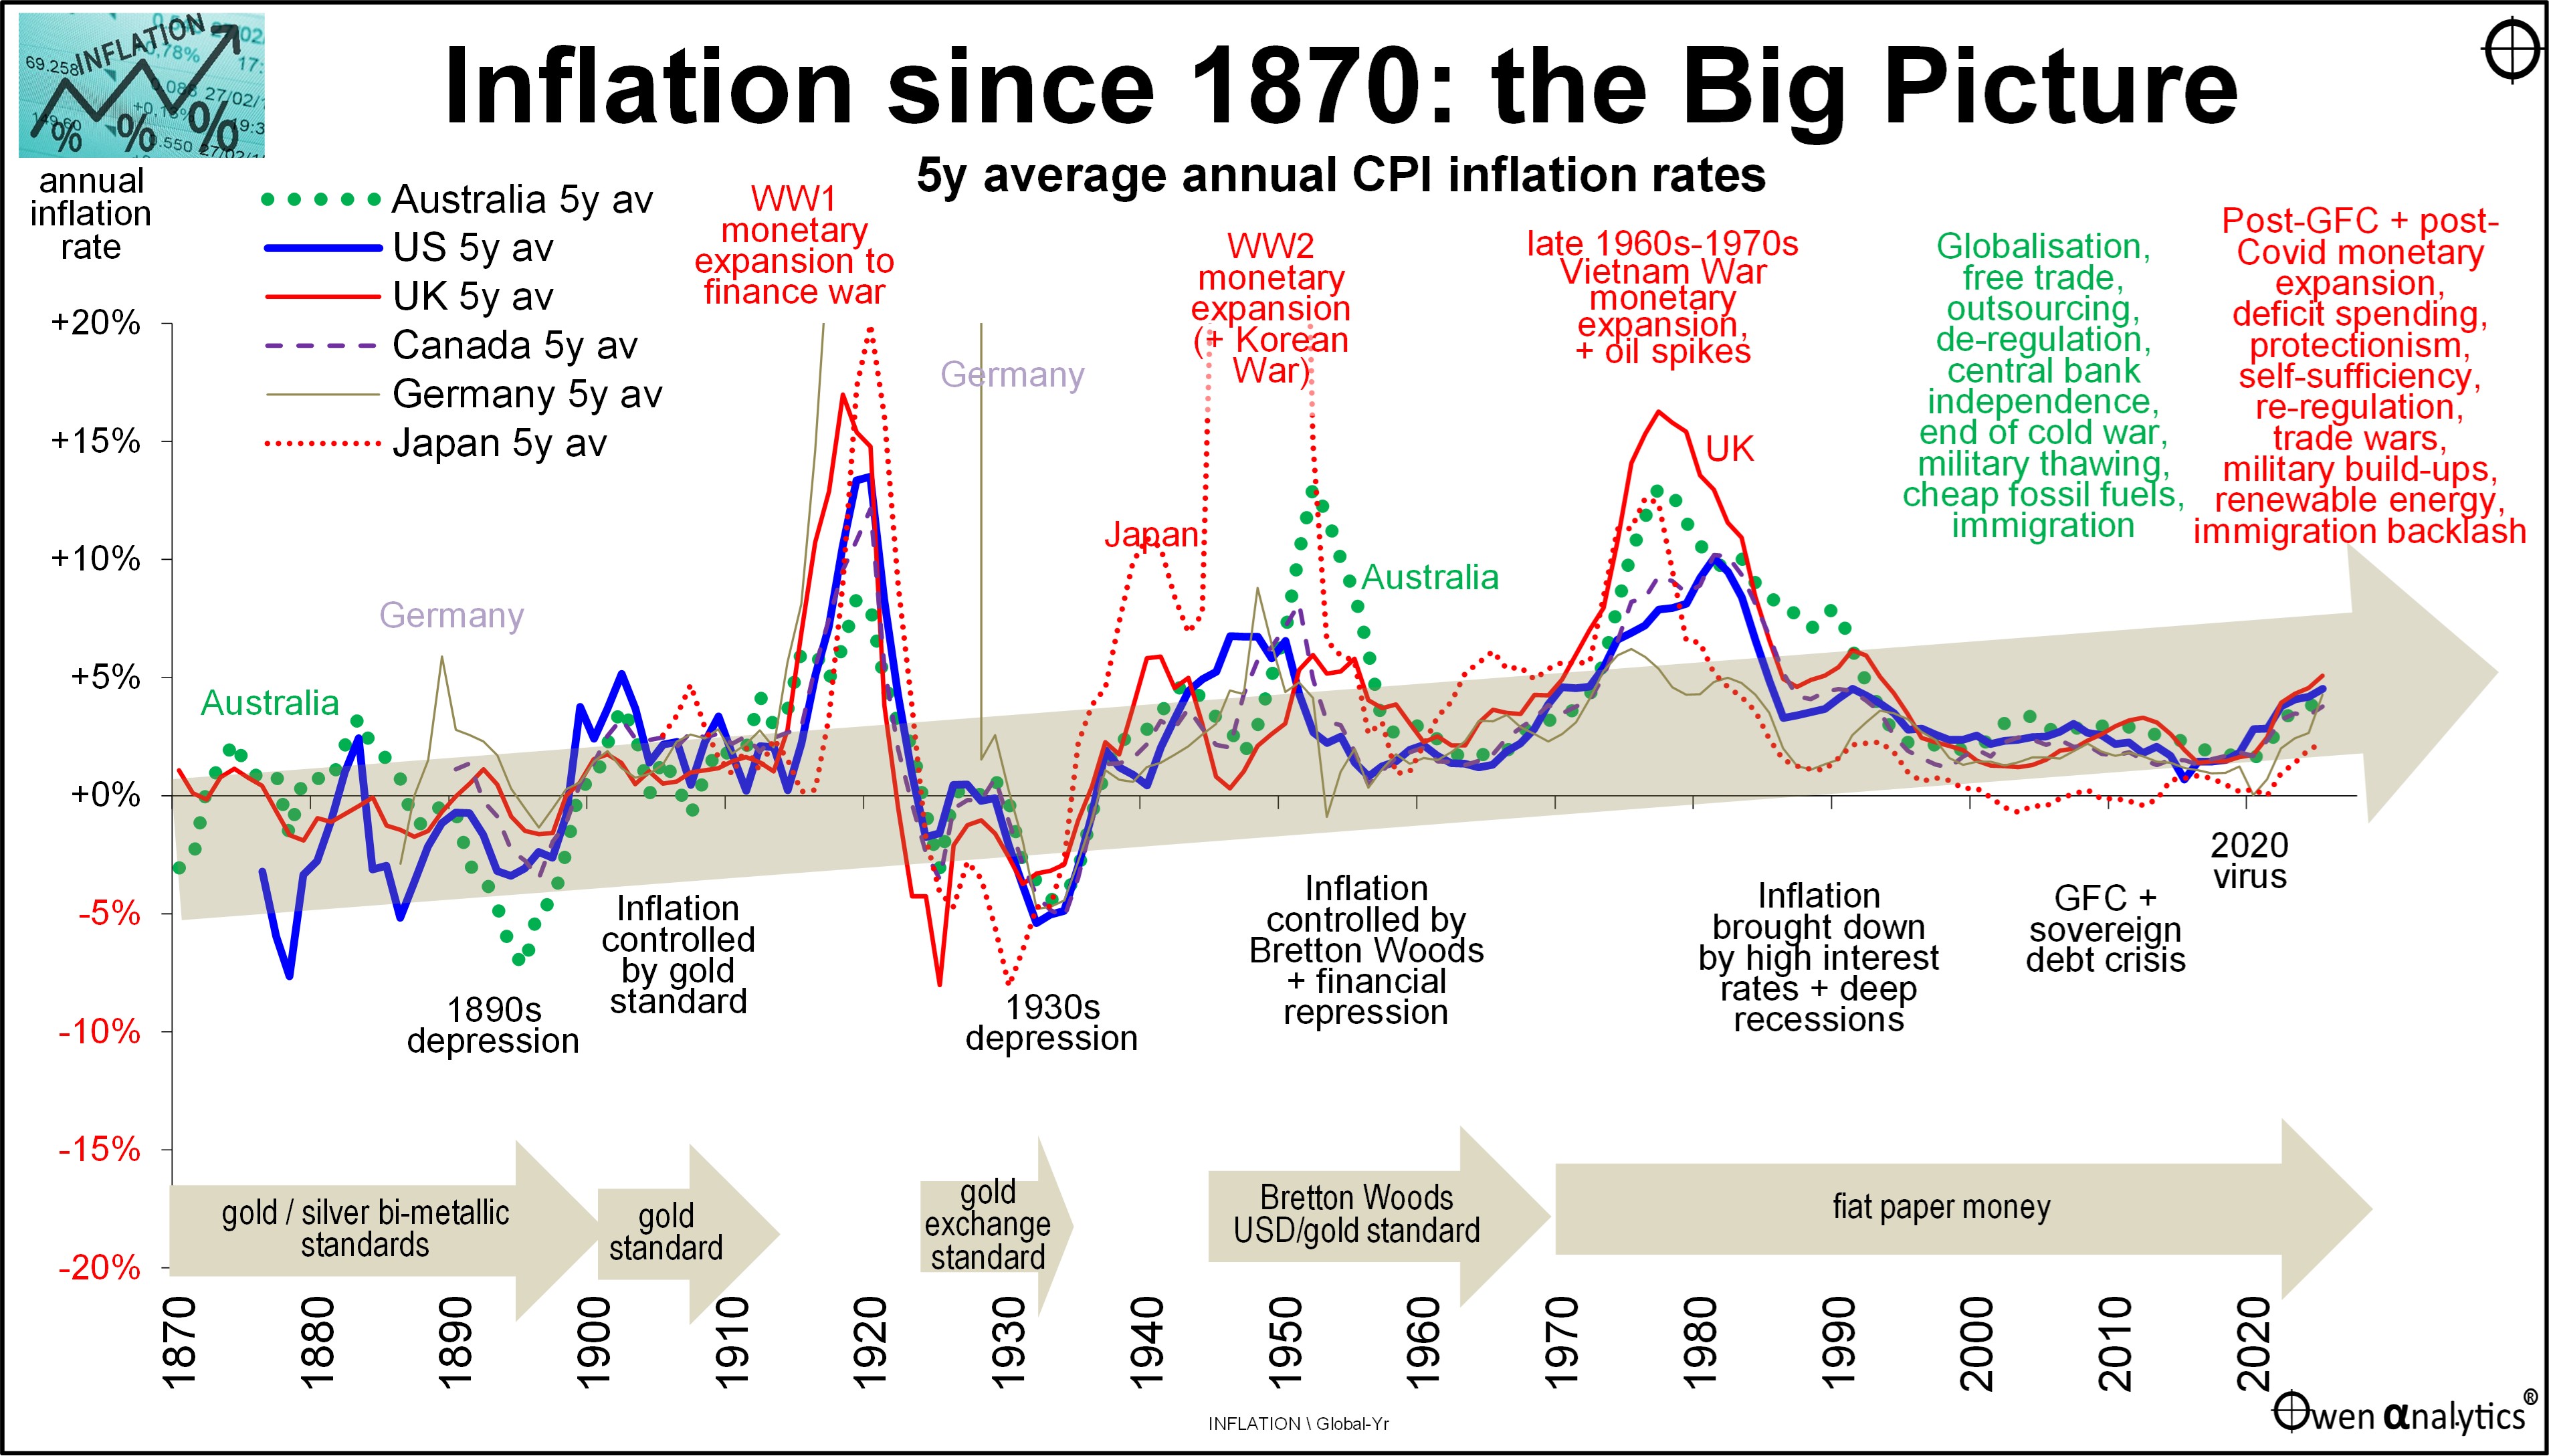
Today’s chart shows inflation rates in Australia and other major global markets since 1870. Here I have used five-year average inflation rates in each market in order to smooth over temporary effects like cyclical booms and busts, recessions and rebounds, and one-off impacts like the GFC, Covid, etc.
Click to enlarge
1 – Inflation is a global phenomenon
The first obvious stand-out is that inflation in all markets travel along similar paths. Each market is different of course due to local variations – like German hyperinflation in the early 1920s and Japanese hyperinflation in the late 1940s.
But, aside from local differences here and there, they all follow the same overall path. Why? Because capital markets are global.
Economic and monetary theory/ dogma/ fads are also global. We can see this clearly on the chart as the world shifted from one dominant theory to the next. Each monetary theory/ dogma/ fad-du-jour takes about a generation to be abandoned and replaced by the next.
We have just moved into a new phase, as explained below.
2 – Overall rising inflation over time
A second immediate observation is that there has been a persistent upward inflationary trend over the past 150 years covered by this chart.
This runs against academic finance theory, which does acknowledge and accept diversions from the mean, but it assumes reversion to some long-term average or mean level. From this chart it is clear that there is no long-term average level for inflation. On the contrary, there seems to be a long-term trend upward over time – over this 150-year medium-term time frame anyway.
3 – Multi-decade phases along the way
A third observation is that inflation appears to work in multi-decade phases – switching from long periods of rising and high inflation, to long periods of falling/low inflation, and back again.
Why? A combination of global geo-political structure and conditions, and economic/monetary theory phases.
4 – Military build-ups
We can see on the chart that the three periods of high inflation in the past 150 years were all driven by military build-ups and war-time spending. This has been the pattern throughout history in general, going back literally thousands of years. Governments have always resorted to inflationary money-printing to finance military build-ups and wars.
(I have studied dozens of repeats of this consistent pattern - since Dionysius (405 - 367 BC), the despotic and tyrannical ruler of Syracuse (Sicily) during the wars between the Corinthians, Athenians and Carthaginians for the control of Syracuse. Dionysius invented two great weapons of mass destruction – the catapult and money debasement. The catapult was used to great effect in destroying the Athenians, but his debasement of money in his own city to finance the war resulted in rising inflation, unrest and rebellion among his people, and led to his ultimate downfall. But that is another story for another day!)
5 – Now into the next rising inflation / interest rate phase
We have just enjoyed a wonderful multi-decade period of declining/low inflation since the early 1980s inflation-busting recessions in the US and UK (Australia was a decade late and only seriously tackled inflation in the 1990-91 recession).
That wonderful era of declining inflation and interest rates, which resulted in high real returns on shares and bonds, is now over.
Since the 2020-21 Covid stimulus spending sprees, the world is now into the next period of rising/high inflation.
Why? Because the recent disinflation era of declining inflation and interest rates did not happen by chance. It was the result of a set of ideas that were born out of failure of the post-WW2 policies that resulted in high inflation and stagnant growth from the late-1960s to late 1970s.
The problem now is that every one of the factors that drove lower inflation and interest rates in the recent disinflation cycle have now ended and reversed, and are now driving inflation and interest rates higher:
- Free trade with stable, low tariffs – now volatile, unpredictable tariff wars.
- Outsourcing to cheap labour countries – now ‘on-shoring’, ‘friend-shoring’ at higher cost.
- Specialisation in industries with comparative advantage – now national ‘self-sufficiency’.
- Globalisation – now trading blocs between strategic allies.
- ‘Just-in-time’ supply chains – now ‘just-in-case’ requiring higher inventories and working capital.
- Free movement of people – now increasingly xenophobic backlashes, restrictions.
- Free movement of ideas – now increasingly restricted, weaponised.
- ‘Rules-based’ international order – now volatile, power-based ‘law of the jungle’.
- ‘Peace dividend’ - lower military spending after fall of Soviet empire – now rising military spending everywhere.
- Central bank independence – now increasingly political and pressured to support government deficits/debt.
- De-regulation of financial markets – now re-regulation, rising costs of compliance, remediation.
- De-regulation labour markets – now re-regulation, rigidities, centralisation.
- Expansion of cheap fossil fuels lowering energy prices – now capital-intensive transition to ‘renewables’, more red/green/black tape/costs for new projects.
- Stable flow of cheap oil from petro-dollar middle east – now unstable, volatile.
- ‘Balanced budgets over a cycle’ – now endless government deficits and debts.
- Schumpeter’s cleansing/renewing power of recessions and bankruptcies – now governments bail out everything.
- Small government mantra – is now big governments, interfering in anything and everything.
- Individual self-reliance – now cradle-to-grave universal welfare state.
- Free markets – now government subsidising political pet projects, ‘strategic’ industries, distorting/diverting capital.
This new economic orthodoxy driving inflation (and interest rates) higher will probably last a couple of decades or so until it too fails and is replaced by the next set of ideas, as in past cycles.
The counter view
Meanwhile, while each of the above factors drove inflation down in the last era and are now driving inflation upward in the current era, the ‘ai’ crowd insists that ‘ai’ will reduce the labour cost of everything to zero and therefore dramatically reduce the cost of all goods and services, driving CPI inflation down to near zero.
Which will it be? Who knows? Personally, I am in the higher inflation camp.
The ‘so-what’ for investors
Since inflation seems to work in long, multi-decade cycles, and is certainly not constant or random, we need to ensure that our investment strategies for long-term portfolios take into account the likely inflationary outlook from where we stand today. It would be unwise to merely assume that inflation and investment returns from the last few decades will continue into future decades, or that inflation will miraculously settle back to its long-term average and stay there forever.
The problem is that Boomers (through pure luck of birth) got rich during the golden post-1980s era of declining inflation and interest rates which boosted real returns on shares, bonds and real estate, and boosted their current retirement portfolios to where they are today.
All of those great-looking 10-year, 20-year and even 30-year historical returns from Super funds (and our own funds) will NOT be repeated in the future. They were boosted by tailwinds of declining and low inflation and interest rates. That era has not only ENDED but is now REVERSED into the current new era of RISING inflation and interest rates, which will depress future nominal and real returns.
Younger generations (born in 1990s-2000s, who are now early in their investing journeys) drew the short straw, just like the generation of investors born in the 1940s, 1880s, etc (ie 20 years before rising inflation cycles).
They face much lower nominal real returns from shares, bonds and real estate during their next couple of decades. (Mind you, many of the Boomers’ kids and grandkids are benefiting in the form of inheritances and ‘Bank of Mum and Dad’).
Retirement planning?
How does this affect questions like ‘How much do I need’ and ‘How much can I afford to spend’?
Calculations based on simply extrapolating the past three decades of great returns are probably going to turn out to be far too optimistic.
By the time you realise this, it may be too late to ‘go back to work’, or ‘take on a new side-gig’, or ‘cut spending’. It would be prudent to assume that more capital is required per dollar of spending, and that the proportion of capital that you can safely afford to spend, is probably lower than the traditional calculations suggest.
(Personally, I have always based my plans on a minimum multiple of 25-30 times spending, ie max spend rate of 3-4% of investment fund. Just cautious I guess, as I have always focused on understanding drivers of returns rather than just extrapolating the past into the future.)
Ashley Owen, CFA is Founder and Principal of OwenAnalytics. Ashley is a well-known Australian market commentator with over 40 years’ experience. This article is for general information purposes only and does not consider the circumstances of any individual. You can subscribe to OwenAnalytics Newsletter here.